
People generally rely on common industry tools to report link-utilization and use this insight to estimate probably the most important aspect of a network: Bandwidth requirement. Let’s revisit this approach and avoid the holes to make a better informed decision.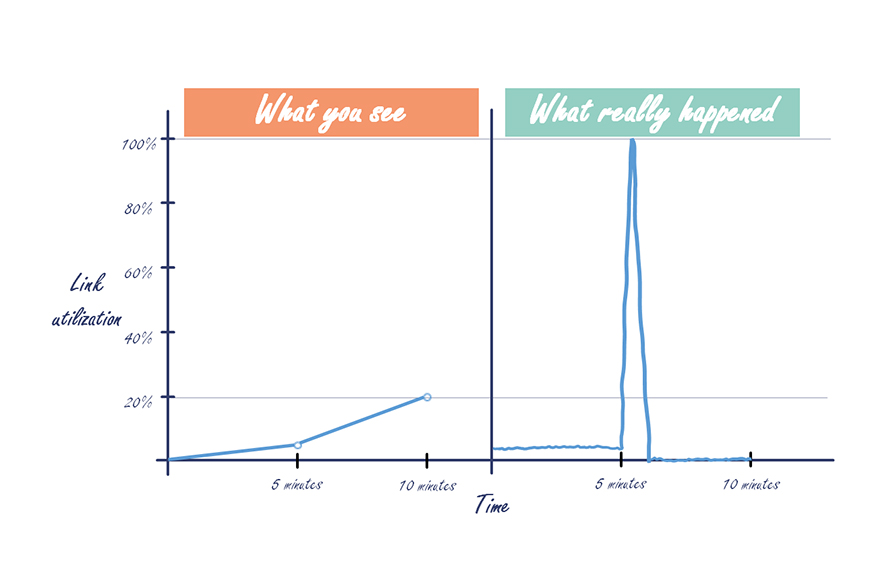
I often come across the below thought:
The links in our network are under 40% utilized. We do not need more bandwidth.
Common but misleading
Even though this statement sounds correct, there is more than meets the eye. Is it possible that you need more bandwidth even though the reported link utilization is under 40%? Certainly, yes. In fact, with the deep penetration of all flash arrays, this phenomenon is become more and more prevalent. I have seen this behavior with multiple deployments, ranging from small to large size storage fabrics. This is a vast subject but today I will focus on the not-so-obvious difference between link-utilization and bandwidth requirement.
Consider three polling cycles at time 0, 5 and 10 minutes. Let’s assume the reported values are 0, 10 billion and 60 billion bytes respectively. The NMS takes the delta in the reported bytes and divide it by the polling duration to calculate the link utilization. At time = 5 minutes, delta is 10 billion bytes. This results in 267 Mbps.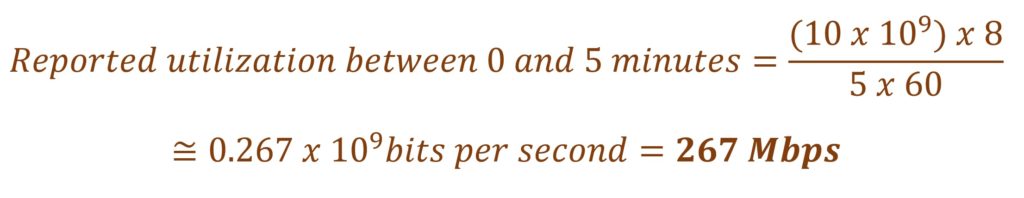
(Multiply by 8 to convert to bits. Convert 5 minutes into seconds by dividing by 5 x 60)
At time = 10 minutes, delta is 50 billion bytes (60 minus 10). This results in 1, 333 Mbps.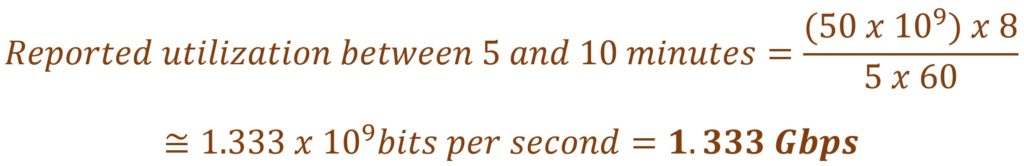
(Multiply by 8 to convert to bits. Convert 5 minutes into seconds by dividing by 5 x 60)
It is a common industry practice to use this output on a NMS to report link-utilization. In this example, the link utilization is 1.3 Gbps, which is just under 20% of the 6.7 Gbps capacity of the 8G FC link. Look good?
What really happens on a network port
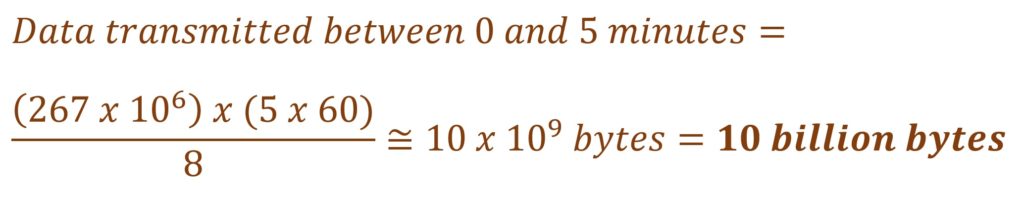 (Divide by 8 to convert to bytes. Convert 5 minutes into seconds by multiplying by 5 x 60)
All is well till now.
But at time = 5 minutes, the application causes a traffic burst resulting in line rate utilization for next 60 seconds. At 6.7 Gbps, a port can transmit 50 billion bytes in approximately 60 seconds.
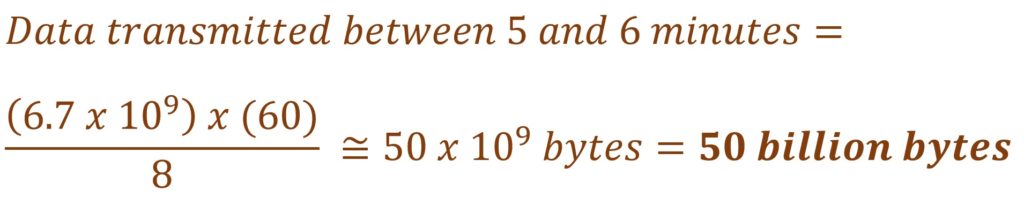
(Divide by 8 to convert to bytes. Convert 1 minute into seconds by multiplying by 60)
Following this, the port remains idle for the next 4 minutes. At the end of 10 minutes, the NMS still sees 60 billion bytes total with no visibility into the traffic burst within last 4 minutes.