
Last Updated on December 16, 2019 by Paresh Gupta
It took me less than 2 days to develop my first app to monitor a Cisco UCS blade server. Using Python SDK to pull metrics from UCS Manager is easy. But building a production app requires much more. In 2019, I built a full-blown UCS traffic monitoring app and named it UTM (UCS Traffic Monitoring). Below are my notes from the journey which would have heavily helped me had I found them before.
Do you know where vNIC/vHBA reside in a Cisco UCS blade server? How do they share the same wire to send or receive traffic? Which uplink port on Fabric Interconnect is used by them (called uplink pinning)? There is much more that you should know before monitoring a UCS server in a meaningful way. Jump to the next section if you are already an expert. If not, here are some great resources to get you started.
Go to ciscolive.com to get free access to the recording and the slides of the technical breakout sessions. Search the On-Demand Library for terms like – ucs architecture – or refer directly to the below sessions:
- BRKCOM-2004: Traffic Monitoring and Engineering for UCS
- BRKINI-2011: Lessons Learned: Troubleshooting UCS from a TAC Engineer’s Perspective
- BRKCOM-3002: UCS Performance Troubleshooting
- BRKINI-2025: UCS Networking – Deep Dive
Cisco Live is organized 4 times a year across different geographies. The content is refreshed as newer content is published. Direct links may not work forever. Go to ciscolive.com and search for the session ID or the title.
Brad Hedlund’s videos on Cisco UCS architecture is another great resource. Cisco UCS architecture is well explained in official white papers also. You should be able to find them via a web search or go to www.cisco.com/go/ucs > Products > UCS B-Series blade servers > Data Sheets and Literature > White Papers.
You are probably already an expert of UCS architecture or have educated yourself from the links shared above. Next, you need to know how exactly the statistics are collected from various hardware and software components. Here are some great resources to get started.
- UCS Tech Talk: Demystifying Monitoring for Cisco UCS Manager and Standalone C-Series Servers.
- Cisco UCS Monitoring Resource Handbook.
- Demystifying Monitoring Tech Talk on Cisco communities.
Eric Williams is one of the key authors and speakers in the tech talk. He is a great person. I was fortunate to receive direct help from him. I strongly recommend reading the information on the above links. Here is a short summary.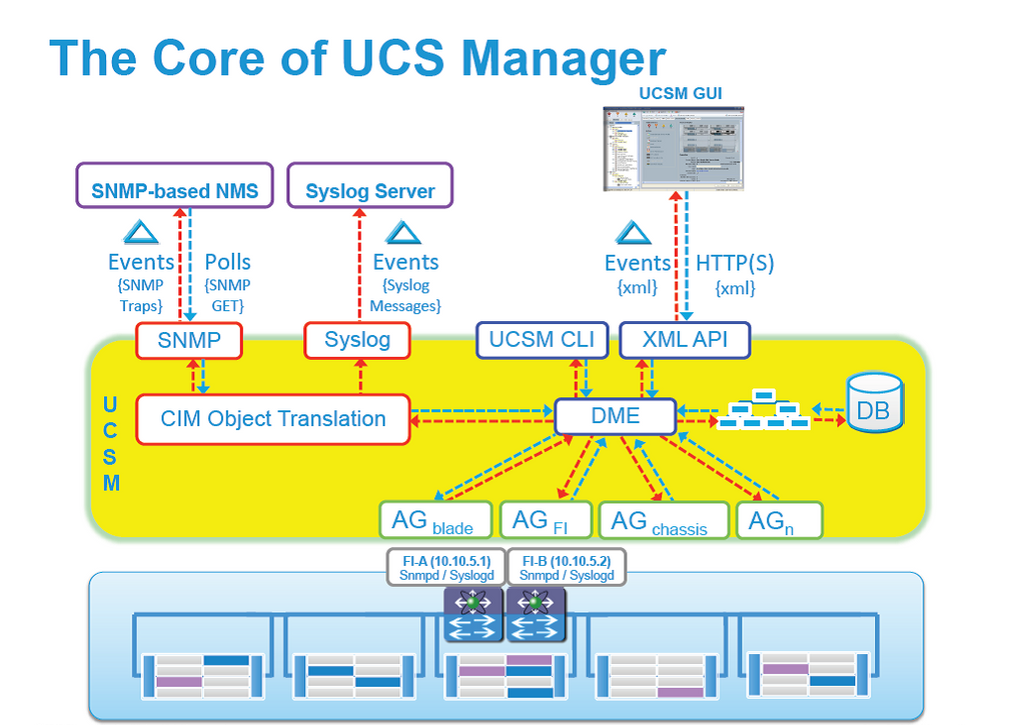
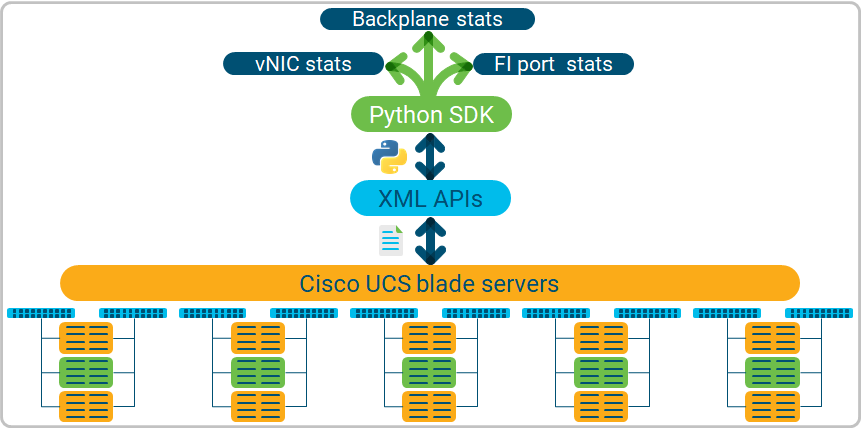
The DME (Data Management Engine) is the core and central element in a UCS domain. All user-visible and external interfaces like CLI, SNMP, Syslog, XML APIs, etc. interact with the DME. Application Gateways (AG) work independently to interact with various other components to update the information in the DME. For example, AG for blade server updates statistics from blade servers. Similarly, AG for chassis updates statistics from chassis and so on. The XML APIs make the core of the UCS domain. It is not an after-thought. Cisco’s own applications like UCS manager, UCS central and Intersight use XML APIs and hence, the response is reliable and trustworthy.
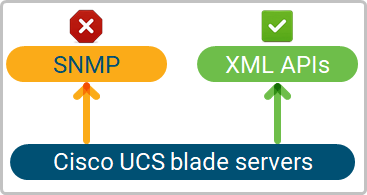 Contrary to its name (Simple Network Management Protocol), there is nothing Simple in SNMP. Use SNMP to monitor Cisco UCS if and only if you:
- Have an existing/legacy app that supports only SNMP and wish to monitor UCS in the same app.
- Are carried away by the fact that information provided by SNMP is same as the XML APIs.
I did not use SNMP and recommend you the same because:
- It is bad for performance.
- It is hard to use. There is a crazy long list of OIDs which are impossible for a human brain to remember. You must – almost always – load vendor specific MIBs
- SNMP is so 1990s.
I wasn’t a fan of SNMP when I used it the very first-time decades ago. My outlook hasn’t changed yet. XML APIs are powerful, simple to use and the recommended approach.
You can use raw XML APIs directly. No problem with that approach. You would have to manage the session and the data encoding/decoding. Here is an official link (or just google it). Your experience can be much smoother by using Python SDK which is built on top of XML APIs. There is no functional difference between the two. There may be some limited functionality that may not be available in Python SDK but those are exceptions (More on full coverage and exceptions later).
Resources – Cisco UCS Python SDK
- Devnet session at Cisco Live Berlin 2017 – John McDonough (another great person and guided me 1-on-1)
- GitHub – UCS Python SDK Code .
- Sample and Example code using Python SDK on GitHub.
I strongly recommend watching the YouTube video and practice the code samples. Most of the learning will be by self-practice and making your hands dirty.
Cisco UCS Python SDK – Quick Tutorial
Here is a short explanation.
Install UCSM SDK
python3 -m pip install ucsmsdkImport UcsHandle and create a new handle.
Import UcsHandle in your application and create a new handle for a UCS domain. Browse the documentation for the available functions.
# python3
Python 3.6.8 (default, Aug  7 2019, 17:28:10)
[GCC 4.8.5 20150623 (Red Hat 4.8.5-39)] on linux
Type "help", "copyright", "credits" or "license" for more information.
>>> from ucsmsdk.ucshandle import UcsHandle
>>> handle = UcsHandle('ucsm_ip_address','user','password')
>>> help(UcsHandle)
Help on class UcsHandle in module ucsmsdk.ucshandle:

class UcsHandle(ucsmsdk.ucssession.UcsSession)
 |  UcsHandle class is the user interface point for any Ucs related communication.
 |
 |  Args:
 |      ip (str): The IP or Hostname of the UCS Server
 |      username (str): The username as configured on the UCS Server
 |      password (str): The password as configured on the UCS Server
 |      port (int or None): The port number to be used during connection
 |      secure (bool or None): True for secure connection, otherwise False
 |      proxy (str): The proxy object to be used to connect
 |
 |  Example:
 |      handle = UcsHandle("192.168.1.1","admin","password")
 |
 |      handle = UcsHandle("192.168.1.1","admin","password", secure=True)
 |
 |      handle = UcsHandle("192.168.1.1","admin","password", secure=False)
 |
 |      handle = UcsHandle("192.168.1.1","admin","password", port=80)
 |
 |      handle = UcsHandle("192.168.1.1","admin","password", port=443)
 |
 |      handle = UcsHandle("192.168.1.1","admin","password", port=100, secure=True)
 |
 |      handle = UcsHandle("192.168.1.1","admin","password", port=100, secure=False)
 |
 |  Method resolution order:
 |      UcsHandle
 |      ucsmsdk.ucssession.UcsSession
 |      builtins.object
 |
 |  Methods defined here:
 |
 |  __init__(self, ip, username, password, port=None, secure=None, proxy=None, timeout=None)
 |      Initialize self.  See help(type(self)) for accurate signature.
 |
 |  add_mo(self, mo, modify_present=False, tag=None)
 |      Adds a managed object to the UcsHandle commit buffer.
…
…
…
Login to the UCS domain
>>> handle.login()
True
>>>
Query the UCS domain
Query the UCS domain with a specific class ID. In response, you will get a list of managed objects (MO). A MO carries multiple items in key-value format. You can iterate over the list using a for-loop. A Distinguished Name (DN) uniquely identified a Managed Object (MO). For example, class ID TopSystem contains a single MO. The DN of this MO is sys.
>>> obj = handle.query_classid(class_id="TopSystem")
for item in obj:
...  print (item)
...

Managed Object                  :       TopSystem
--------------
class_id                        :TopSystem
address                         :
child_action                    :None
current_time                    :2019-11-24T11:28:47.216
descr                           :
dn                              :sys
ipv6_addr                       :::
mode                            :cluster
name                            :FI6248-28
owner                           :
rn                              :sys
sacl                            :None
site                            :
status                          :None
system_up_time                  :228:19:45:30
At the end – Logout
Finally, do not forget to logout from the UCS domain.
>>> handle.logout()
True
>>> quit()
I used a few jargon in the above text like class ID, MO, DN, etc. John McDonough has explained these terms in the YouTube video shared above.
Understanding the jargon – Class, MO, DN, etc.
Cisco UCS, by design, is hierarchical in nature. At the very top of the tree, is a UCS domain which may have:
- One or two Fabric Interconnects (FI).
- The FIs have many ports.
- A UCS domain may have up to 20 chassis.
- A chassis may have up to 8 blades.
- A blade may have multiple adapters
- An adapter may have multiple vNIC and vHBA.
A class is a unique way to access similar components in the UCS hierarchy. For example, the statistics of vNICs on adapters are accessed using the class ID AdaptorVnicStats. But there may be hundreds or thousands of vNICs in a UCS domain. A unique managed object (MO) carries the statistics of different vNICs and a unique Distinguished Name (DN) identified a MO. For example, following is the response of query_classid(class_id=’AdaptorVnicStats’) . Notice the list of MOs and their DNs.
# python3
Python 3.6.8 (default, Aug  7 2019, 17:28:10)
[GCC 4.8.5 20150623 (Red Hat 4.8.5-39)] on linux
Type "help", "copyright", "credits" or "license" for more information.
>>> from ucsmsdk.ucshandle import UcsHandle
>>> handle = UcsHandle(‘ucsm_ip’, ‘user’, ‘password’)
>>> handle.login()
True
>>> obj = handle.query_classid(class_id="AdaptorVnicStats")
>>> for item in obj:
...  print('dn:', item.dn, '\nbytes_tx:', item.bytes_tx, '\nbytes_rx:', item.bytes_rx, '\n===')
...
===
dn: sys/chassis-1/blade-6/adaptor-1/host-fc-2/vnic-stats
bytes_tx: 10514725485156
bytes_rx: 10633297804972
===
dn: sys/chassis-1/blade-8/adaptor-1/host-fc-3/vnic-stats
bytes_tx: 2000
bytes_rx: 3736
===
dn: sys/chassis-1/blade-8/adaptor-1/host-fc-4/vnic-stats
bytes_tx: 800
bytes_rx: 1560
===
dn: sys/chassis-1/blade-8/adaptor-1/host-fc-1/vnic-stats
bytes_tx: 2444
bytes_rx: 22252
===
dn: sys/chassis-1/blade-8/adaptor-1/host-fc-2/vnic-stats
bytes_tx: 1460
bytes_rx: 17092
===
In this example, class ID is AdaptorVnicStats. List of MOs is returned by handle.query_classid(). Every MO has a unique DN as shown below.
dn: sys/chassis-1/blade-6/adaptor-1/host-fc-2/vnic-stats
dn: sys/chassis-1/blade-8/adaptor-1/host-fc-3/vnic-stats
dn: sys/chassis-1/blade-8/adaptor-1/host-fc-4/vnic-stats
dn: sys/chassis-1/blade-8/adaptor-1/host-fc-1/vnic-stats
dn: sys/chassis-1/blade-8/adaptor-1/host-fc-2/vnic-stats
To summarize
You need a class ID to query statistics from a component in a UCS domain (like vNIC). The response carries a list of MO, each identified by a unique DN. The unique DN can be used to associate the statistics to the correct component in a UCS domain. You must know a class ID to query a UCS domain. In the above example, I used AdaptorVnicStats but how do you query statistics for vHBA, FI uplink ports, FI server ports, etc? That takes us to the question, how do you find a relevant class ID?
If you have reached this far, you must be aware that the DME makes the central storage within UCS. Northbound (external) interfaces like XML APIs (used by Python SDK) are used to interact with the DME. You must have also used UCS Manager before. Any guess how does UCS Manager access information from the hardware components? How does it pull the information it shows in the GUI? How does it apply the changes after you click submit? If you are thinking about the XML APIs, you are correct! Anything that you see and change on UCSM GUI is communicated with the UCS hardware via the XML APIs.
Here is an example
Navigate to Equipment tab > Equipment > Chassis > Chassis 1 > Servers. You see a tabular output of all the servers in the chassis with their names, overall status, PID, Model, Serial, CPU cores, memory, adapters, vNIC, vHBA, etc. This information resides within the MOs that can be accessed by a class ID. When this screen is loaded, the UCSM GUI sends a request to the DME and extracts the shown information from the response. The response is in XML format, containing the class ID and managed objects (MO). You can access the full XML response by selecting an item, right click > Copy XML.
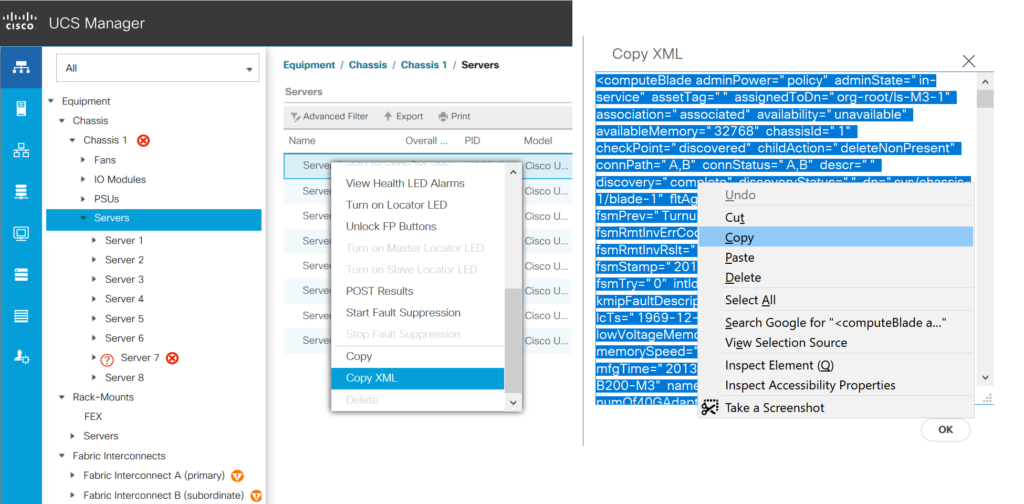
The output may be huge. Paste it into your favorite text editor and enable syntax highlighting for XML.
<computeBlade adminPower="policy" adminState="in-service" assetTag="" assignedToDn="org-root/ls-M3-1" association="associated" availability="unavailable" availableMemory="32768" chassisId="1" checkPoint="discovered" childAction="deleteNonPresent" connPath="A,B" connStatus="A,B" descr="" discovery="complete" discoveryStatus="" dn="sys/chassis-1/blade-1" fltAggr="0" fsmDescr="" fsmFlags="" fsmPrev="TurnupSuccess" fsmProgr="100" fsmRmtInvErrCode="none" fsmRmtInvErrDescr="" fsmRmtInvRslt="" fsmStageDescr="" fsmStamp="2019-07-08T11:34:47.220" fsmStatus="nop" fsmTry="0" intId="123331" kmipFault="no" kmipFaultDescription="" lc="undiscovered" lcTs="1969-12-31T16:00:00.000" localId="" lowVoltageMemory="regular-voltage" managingInst="A" memorySpeed="1333" mfgTime="2013-12-11T00:00:00.000" model="UCSB-B200-M3" name="" numOf40GAdaptorsWithOldFw="0" numOf40GAdaptorsWithUnknownFw="0" numOfAdaptors="1" numOfCores="8" numOfCoresEnabled="8" numOfCpus="2" numOfEthHostIfs="112" numOfFcHostIfs="4" numOfThreads="8" operPower="on" operPwrTransSrc="software_mcserver" operQualifier="" operQualifierReason="N/A" operSolutionStackType="none" operState="ok" operability="operable" originalUuid="d65bb5e2-6d3f-4250-92da-8073c36ded9f" partNumber="73-14689-04" policyLevel="0" policyOwner="local" presence="equipped" revision="0" scaledMode="none" serial="FCH17487MU8" serverId="1/1" slotId="1" storageOperQualifier="unknown" totalMemory="32768" usrLbl="" uuid="30678480-52da-11e9-0000-00000000006f" vendor="Cisco Systems Inc" vid="V06">
The above example shows a MO with DN sys/chassis-1/blade-1 and class ID computeBlade. A managed object (MO) of a class ID may carry a lot more information than shown on a screen. The UCSM GUI may choose to display only partial information or make the output powerful by fetching the information from multiple classes and stitching them together. Overall, find a related screen in UCSM. Select an item, right click > Copy XML. The XML output will give you the class ID. You can follow the same steps to find class ID for vNIC stats, vHBA stats, FI port stats, etc. This approach works great for finding one class ID but does not help much to find the children or parent of a MO. Is there a better way to navigate the tree-like structure of the DME? There is! Keep reading.
You must have used your web browser to access Cisco UCS Manager. Try opening the same address with a visore.html as a suffix. For example, use https://x.x.x.x/ to access UCS Manager and use https://x.x.x.x/visore.html to visualize the DME model within UCS.
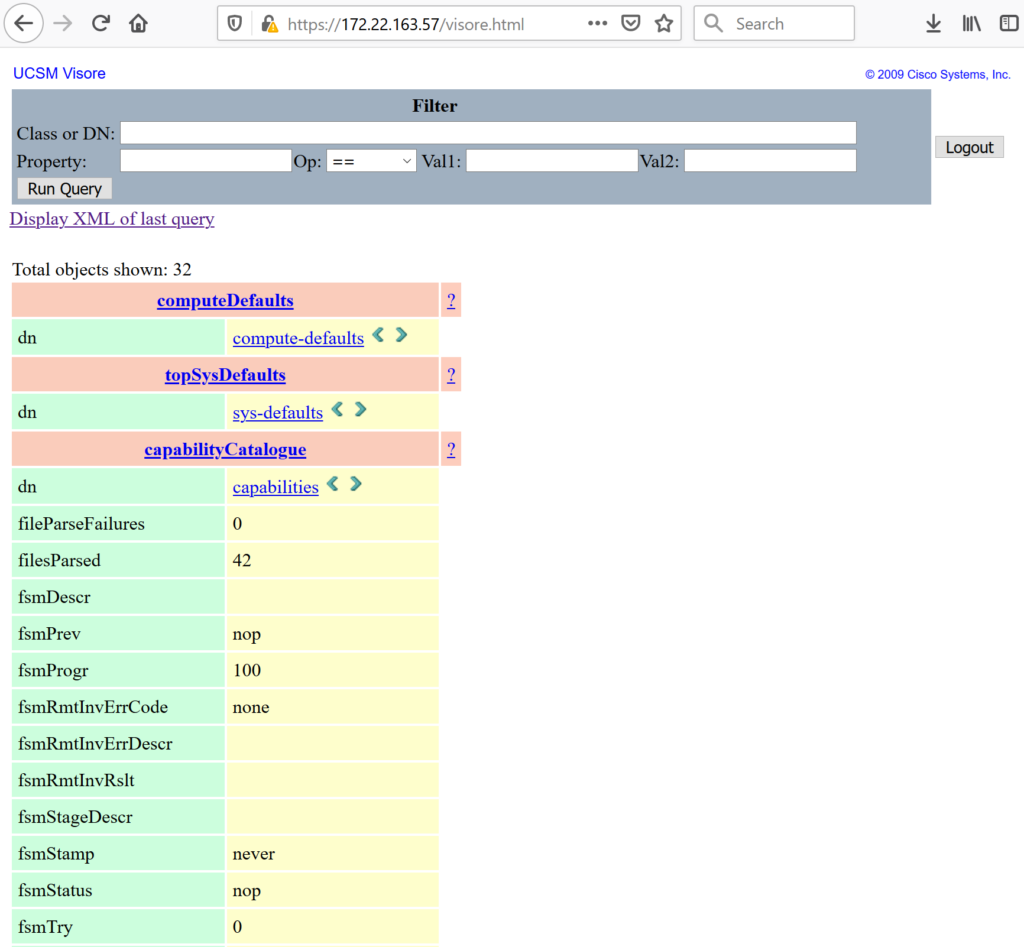
Tips to use visore:
- visore is case sensitive. If a query does not return value, try changing the case of the class ID. For example, ComputeBlade does not work but computeBlade works.
- The green left and right arrows next to the dn can be clicked to browse the hierarchy of the DME.
- sys makes the root of the tree within the DME.
Before discussing some of the best-practices of Cisco UCS Python SDK, you should know:
- The architecture of Cisco UCS blade server
- Traffic flow within a UCS domain
- The DME model and concepts of class ID, managed object (MO), distinguished name (DN), etc.
- Basics of using the Python SDK (especially the
query_classids()function) and extract statistics from the response.
Scroll above for short explanation of these bullets. When you are ready, read below some of the best practices while using the UCS Python SDK.
You can use the query_classid() function to get a list of managed objects (MOs) that are identified by a class ID. However, there is another similar function called query_classids() which allows you to query multiple classes together. It is recommended to group all the classes in a single query by using query_classids() instead of invoking query_classid() multiple times. Here is an example. Let say you want to pull metrics from 3 classes with ID TopSystem, NetworkElement and ComputeBlade. It is possible to do this:
obj1 = handle.query_classid(class_id="TopSystem")
obj2 = handle.query_classid(class_id="NetworkElement")
obj3 = handle.query_classid(class_id="ComputeBlade")
But do not follow above approach. Do following:
class_ids = ['TopSystem', 'NetworkElement', 'ComputeBlade']
obj = handle. query_classids(class_ids)
Grouping multiple class IDs in a single request is less intensive for a UCS domain.
A Managed object (MO) contains many attributes. Not all of them may be of your interest. For example, MO of type (class ID) AdaptorVnicStats has more than 50 attributes. But you may only need 6 of them. There are two possible options to handle this scenario. First, you can use the filter_str parameter of query_classid() function. This option allows you to filter the response at the source within the UCS domain. Second, you can receive all the attributes in bulk. On the receiver, use whatever you need and drop the rest.
It may be tempting to use filter_str parameter with query_classid() function. But do not use it. Parsing the filter_str can get very resource intensive for UCS server. Additionally, the filter_str can get long and complicated very fast. It also requires you to be an expert of regular expressions. Ultimately, you will end up spending a lot of time in developing your code for the filter_str which is bad for UCS resource utilization.
Overall, it is recommended to receive all the attributes of managed objects (MO) in bulk with no filtering. Data enrichment should be performed on the receiver.
High level work-flow while using the UCS Python SDK would be:
- Create a new
UcsHandle - Login.
- Query statistics from UCSM using
query_classids(). - Logout.
These 4 steps need to be repeated every polling interval (for example 60 seconds). That raises a natural question: Does it really makes sense to create a new handle, login, and log out every 60 seconds? Wouldn’t it be nice to create a new UcsHandle, login and save the session for next time? Absolutely!
I used Python pickle functionality to achieve this. A new UcsHandle is created and login() is called when the application starts. Statistics are pulled but logout is skipped. Instead, the handle is saved to a file for re-use. During the next polling, which maybe 60 seconds later, the saved (or pickled) UcsHandle is read from the file and re-used.
During some testing in my lab environment, I could not notice any major time difference between login and logout every polling interval vs login and saving (pickling). In large production environments, this little trick may yield some performance merits. Especially with external AAA servers, login and logout every 60 seconds can be waste of resources. If you think this does not make sense, follow the next guideline.
Logout is necessary after every login.
>>>
>>> handle.logout()
True
>>>
UCSM will reach the maximum number of open sessions very soon if you do not logout explicitly. You can view open session in UCS Manager under Admin tab > User Management > User Services > Sessions.
The login() function in the UcsHandle has a timeout parameter. Do not leave it to default. Refer to the below code snip.
CONNECTION_TIMEOUT = 10
try:
	handle.login(timeout=CONNECTION_TIMEOUT)
except Exception as e:
	logger.error('UcsHandle {} unable to login to {} in {} seconds : {} :{}'.format(handle, domain_ip,CONNECTION_TIMEOUT, type(e).__name__, e))
	handle = None
else:
	logger.debug('Connection type {} UP for {}'.format(conn_type, domain_ip))
In the above code, the login times out after 10 seconds. Consider making it more aggressive like 5 or 3 seconds. It is not a good choice to delay your whole monitoring app just because a single UCS domain goes unreachable. Leaving this value to default is not a great idea.
Session timeout gets activate after a successful login to a UCS domain. You can see session timeout in UCSM > Admin tab > User Management > User Services > Sessions tab
Above, I discussed two approaches to poll statistics from UCS domain every 60 seconds.
- Option 1: Every polling interval (default: 60 seconds), create a new
UcsHandle, login, query the statistics and logout. Repeat these steps every 60 seconds. - Option 2: Create a new
UcsHandleand login when the application starts. Query statistics and but do not logout. Instead, save (pickle) theUcsHandle. At the next polling interval (60 seconds later), re-use (unpickle) the saved (pickled) session and query the statistics.
Session timeout is not a concern if you choose Option 1 because the life of a session is less than 60 seconds. With option 2, the session remains open in the UCS Manager. It does not know that the receiver is saving the session for re-use. Eventually, the open session will reach the session timeout. In my environment, the session timeout was 7200 seconds (2 hours). Due to this, the statistic pull was generating errors every 2 hours. I handled this scenario by early terminating a session every 90 minutes and re-initiating a new session. You may come up with a better approach. But be aware of this behavior. If you see a periodic failure, session timeout can be one of the culprits.
The default interval to poll statistics from Cisco UCS should be 60 seconds. If a metric is polled every 10 seconds, you are bound to receive the same value until the 60 seconds collection interval lapses. This is because of the way statistics are updated in the DME.
As explained above, DME is central storage of all the statistics. AGs poll the metrics from hardware and software components and update the values in the DME. An external polling agent fetches the information from the DME. External query does not invoke an AG to poll metrics from the underlying hardware and software components. Overall, you can control your query interval (polling interval) which gets you information from the DME. You cannot control (at least from an external monitoring agent) the interval at which AGs update the stats in the DME, called the collection interval. By default, AGs update the DME every 60 seconds (collection interval). Hence, it does not make sense to query sooner than that. Even if you do, the same value is returned.
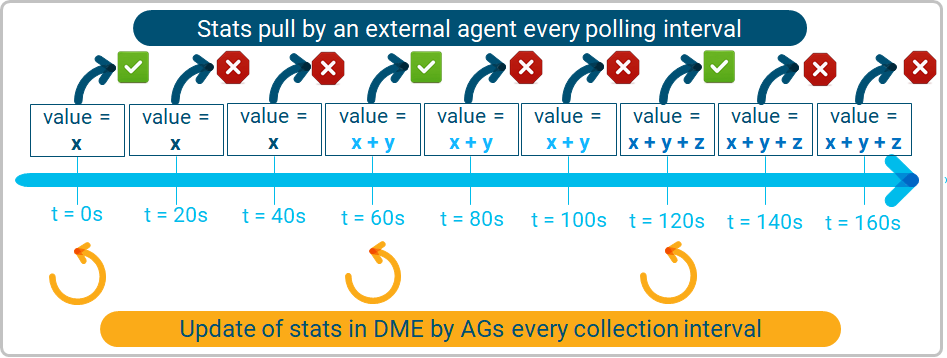
The minimum possible value of the collection interval is 30 seconds. You can make this change in Admin Tab > Stats Management > Collection policies > Collection Policy name.
Watch out for the race condition
It is possible that the external polling interval gets into a race condition with the internal collection interval. For example, the next polling may be triggered after 59.9 seconds while the collection by an AG is performed at 60.1 seconds. If this happens, the statistic will be duplicated in the two subsequent polls. You may choose to design your monitoring agent to handle this corner case or simply ignore it. But be aware that such a race condition is possible.
For more details, refer to Cisco Live session: BRKCOM-2004 – Traffic Monitoring and Engineering for UCS. The session has a detailed explanation of collection interval. There is a similar concept called Reporting Interval, not to be confused with the polling interval discussed in the above text.
Cisco UCS is great in API design and handling. That does not mean there are no open holes. There are cases where the data format is inconsistent across different classes. Here is an example: You want to know the speed of an interface. The returned values can be:
- 10
- 10gbps
- indeterminate
- 0
But you want consistency and prefer a number (like 0 or 10) instead of a string like 10gbps or indeterminate.
Here are some outputs:
>>> obj = handle.query_classid(class_id="FabricFcSanPc")
>>> for item in obj:
...  print(item)
...
Managed Object                  :       FabricFcSanPc
--------------
class_id                        :FabricFcSanPc
admin_speed                     :auto 		<<<
<snip>
oper_speed                      :16 		<<<

>>> obj = handle.query_classid(class_id="FabricEthLanPc")
>>> for item in obj:
...  print(item)
...
Managed Object                  :       FabricEthLanPc
--------------
class_id                        :FabricEthLanPc
admin_speed                     :10gbps 		<<<
<snip>
oper_speed                      :10gbps 		<<<
<snip>

>>> obj = handle.query_classid(class_id="FcPIo")
>>> for item in obj:
...  print(item)
...
Managed Object                  :       FcPIo
--------------
class_id                        :FcPIo
<snip>
max_speed                       :8gbps 		<<<
<snip>
oper_speed                      :indeterminate 		<<<
<snip>
Here is a small function that I wrote to handle this inconsistency.
def get_speed_num_from_string(speed):
    '''
    oper_speed can be 0 or indeterminate or 10 or 10gbps
    * replace indeterminate by 0
    * strip off gbps, just keep 10
    '''
    if 'gbps' in (str)(speed):
        return ((int)(((str)(speed)).rstrip('gbps')))
    elif 'ndeterminat' in ((str)(speed)):
        return 0
    else:
        return ((int)(speed))
You can use this solution or come up with a better approach. But knowing this little detail early in the game can be of great help.
Your requirement is to poll 100 metrics from UCS. 99 work via XML APIs (Python SDK). But just one metric is available only via CLI. This breaks your dream because you are still required to build a separate infrastructure to open SSH session, execute CLI(s), parse and close the session. All this needs to happen while the XML APIs session is open to the same UCS domain to pull the other 99 metrics. You can keep your app simple by not polling the unsupported or wrong counter. But if this is not possible, there are many ways to open SSH session to a remote device, execute commands and parse the output. Python paramiko library is a famous option. I used netmiko library which is based on paramiko but better suited for network devices.
So, are there any know exceptions that I already know? Yes. PAUSE counters is one example that I am aware of.
Watch out for PAUSE counters reported by UCS XML APIs. They may be wrong.
Before sharing the long story, here is a question for you. Do you have an existing application that monitors PAUSE frames in UCS? OR, have you ever used Cisco UCSM to monitor PAUSE frames?
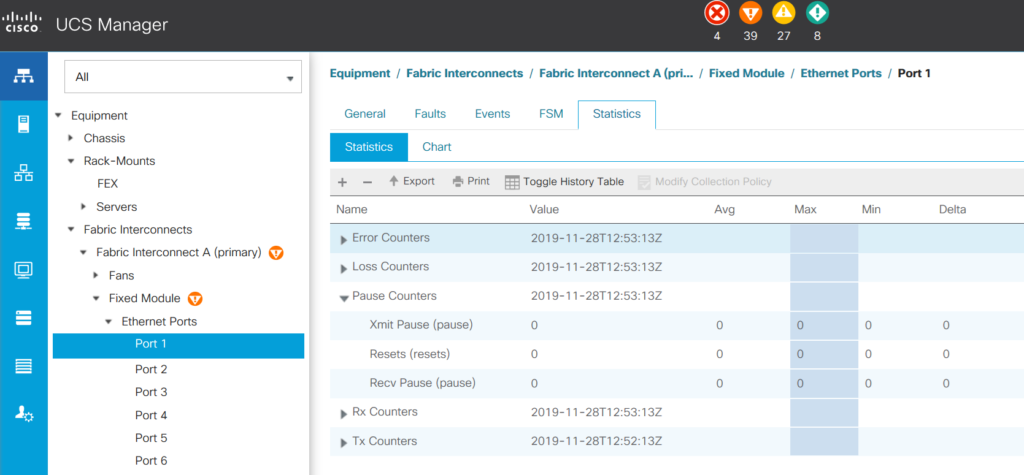
If yes, it is possible that your monitoring app is showing wrong PAUSE counters. At least, UCSM does not show correct values.
Here is the reason. PAUSE frames can operate at per link level (called Link-level flow control or LLFC) or per priority flow level (called Priority Flow Control or PFC). LLFC is disabled by default and PFC is enabled by default. Only one of them can be enabled at a time and changing one to another is disruptive. There is little guidance from Cisco to enable LLFC vs PFC. Hence, most of the customers may not change the default configuration. In summary, unless you are an exception, your UCS servers are operating in PFC mode. That also means that only PFC counters increment but LLFC counters do not increment at all.
The PFC counters are shown under show interface priority-flow-control command on UCS FI NX-OS prompt.
FI6248-1-A(nxos)# show interface priority-flow-control
============================================================
Port               Mode Oper(VL bmap)  RxPPP      TxPPP
============================================================

Ethernet1/1        Auto Off           1567460    3458258
Ethernet1/2        Auto Off           48472      908
Ethernet1/3        Auto Off           255838     3908958
Ethernet1/4        Auto Off           35834      10298564
Ethernet1/5        Auto Off           210645736  2992920
Ethernet1/6        Auto Off           212481923  2899076
Ethernet1/7        Auto Off           211305431  2922852
Ethernet1/8        Auto Off           215129513  3013618
The LLFC counters are shown under show interface command. As explained above, these counters always remain at 0.
FI6248-1-A(nxos)# show int Ethernet1/1 | inc pause
    0 Rx pause
    0 Tx pause
FI6248-1-A(nxos)#
The forgotten fact of the PAUSE counters in Cisco UCS
Now here is the most interesting turn of this story. Other external interfaces like SNMP, XML API, etc. always carry counters from LLFC (as show under show interface command). But LLFC is disabled by default and because of that, the reported PAUSE counters always remain 0. This also explains why the Cisco’s own UCSM always show PAUSE counters as 0. Remember, the query by SNMP or XML APIs does not throw any error. It returns 0, which is still a valid mathematical value. If you wish to monitor the PAUSE frames correctly, the only option is to parse the output of the show interface priority-flow-control command.
As discussed above, 60 seconds should be the default interval to poll statistics from Cisco UCS Manager. You should design to finish polling all the UCS domains within this polling interval. If not, the next polling will start before the previous polling finishes leading to undesirable side effects. Just to be clear, I am referring to two different time values:
- Polling interval: How often the statistics needs to be polled.
- Polling duration: How long it takes to poll all the statistics from all the UCS domains
Make sure that the polling duration is less than the polling interval.
Benchmark results of polling duration
I conducted some tests in my lab environment to measure the time taken to finish a poll. Here are the results with XML APIs (Python SDK):
- Creating a new UcsHandle took only a few milliseconds.
- Login to a UCS domain took a few milliseconds. Login may take longer if an external (AAA) server is used.
- The response of
query_classids()with 20 classes took between 7 – 8 seconds. This may change based on the class type, number and the scale of the system. For example, a UCS domain with 2 chassis takes less time to respond compared to a UCS domain with 15 chassis.
Overall, the total time taken to poll a UCS domain via XML API (Python SDK) took under 8 seconds. I also had to pull statistic using SSH/CLI session (Read here why) with following steps:
- Open a new SSH session.
- Connect to NX-OS console of FI-A
- Execute the command
- Exit from NX-OS console of FI-A
- Connected to NX-OS console of FI-B
- Execute the command
- Exit from NX-OS console of FI-B
- Close the session
The total time take to finish the above 8 steps was 20 seconds. The time taken can be longer if external AAA server is used.
You should calculate these times in your own environment. Irrespective of the exact values, you should design to finish the polling of all the UCS domains within polling interval (60 seconds). Opening sessions in series is a bad idea. Had I initiated XML and SSH connections in series, it would have taken 26 second to finish polling a single UCS domain.
Strategies to optimize the total polling duration
The first optimization is to initiate SSH and XML sessions in parallel. This brought down the time take per UCS domain to 20 seconds.
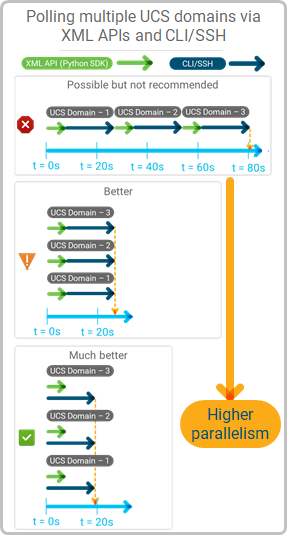
This is only an issue with the multi-threading implementation of Python. You should consult an expert programmer to find a better solution. I solved this issue by creating multiple threads of an umbrella application (written in Go).
The longest delay is due to the SSH/CLI session to the UCS domain. You can reduce this time further by opening two parallel sessions to the same UCS domain. Each session can be dedicated to pull statistics from a single FI only. This approach can save few more seconds which may be worth the effort in large environments or when the polling interval is reduced to 30 seconds.
Overall, measure the time, implement parallelism and finish the polling within the polling interval.