
Last Updated on January 25, 2022 by Paresh Gupta
Over the last few years, I met many customers struggling with the traffic monitoring of Cisco UCS server. Customers knew that the Fabric Interconnect (FI) uplink port is congested. But they can’t figure out which vHBA/vNIC on which server is the root cause. For all these years, my response had been consistent – I can’t help, primarily because I am not part of the UCS business unit in Cisco. But in May 2019 my opinion was about to change. A Technical Solutions Architect in Cisco (Craig) reached out with the same problem. He asked if I could build something using Grafana. That tipping point gave birth to the UCS Traffic Monitoring(UTM) app.
UTM use-cases
UTM provides traffic visibility into Cisco UCS servers. Some examples are FI port statistics (uplink and server ports), IOM statistics (network and backplane ports), vNIC and vHBA statistics, etc. Top use cases are:
- When the FI uplink port is over-utilized, find which vNIC/vHBA on which adaptor on which blade in which chassis is contributing most traffic to that port.
- Detect and pin-point internal congestion via PAUSE frame monitoring on FI server ports and IOM backplane ports.
- Traffic balance check – Verify if the paths A and B are equally utilized.
- Port-channel load-balance verification.
UTM is much more than a traffic graphing engine. It monitors Cisco UCS servers in a much more powerful way. For example, it stitches the end-to-end view between FI uplink ports and server vNIC and vHBA to help find issues quickly.
UTM architecture
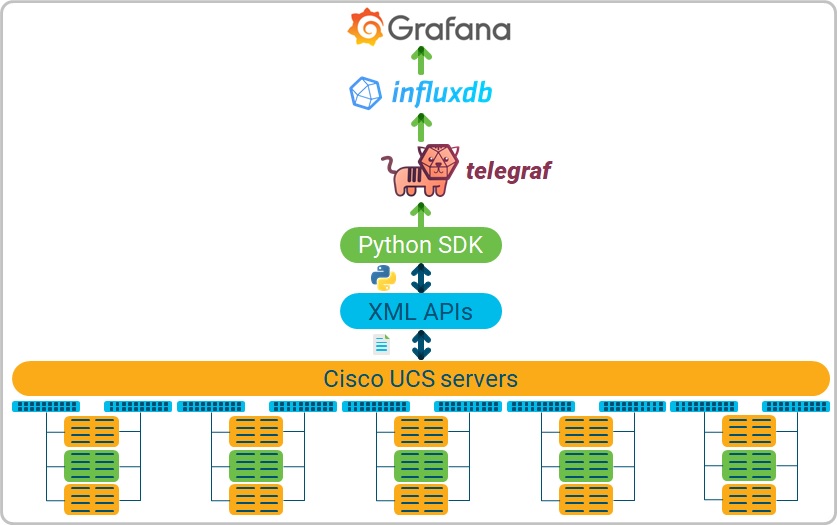
In brief, the architecture of UTM has the following components:
- Cisco UCS collects metrics of various components like vNIC/vHBA, FI ports, IOM ports, etc.
- The metrics are polled every 60 seconds (by default) by a Python script. It is built using Cisco UCSM Python SDK.
- The script is invoked by telegraf using the exec input plugin.
- The script stores the data into InfluxDB. Before that, the data is stitched end-to-end between the FI uplink port and server vNIC and vHBA. This the real value of UTM. It is much more than a graphing engine.
- Finally, Grafana is used to visualize data from InfluxDB.
UTM needs a read-only account for Cisco UCS monitoring.
The heart of the UTM app is built of:
- A Python script that pulls data from Cisco UCS and stitches it end-to-end.
- Grafana dashboards.
I have published the above files on GitHub. You are free to use and extend them further. In this post, I am sharing detailed steps to install the app for Cisco UCS monitoring in a production environment. I assume that you do not have any prior experience in InfluxDB, Telegraf or Grafana. If you do, great! You can skip some of the steps. If you don’t, you have come to the right place.
I learned a lot about UCS XML APIs and their usage while development of UTM. You can check out my other post on the best practices of Cisco UCS XML APIs and Python SDK. Feel free to extend or build your own app for Cisco UCS monitoring.
Hardware and Software requirements
A server with 8 or 16 vCPU, 32 GB of memory, and 100 GB of SSD storage is a good start. These requirements depend on the scale so it is possible that you may have to add more resources in the future when more UCS domains are monitored. More memory and CPU help to load the pages faster while SSD storage is required for overall data read and write performance.
I built and tested UTM on CentOS 7.6. It is possible to use any other Linux variant of your choice. Packages and applications are required on top of the minimal install of the operating system. You can install the packages yourself. The real magic is done by the config files (Python script) which can be imported in your installation. This approach takes a few hours for the complete installation process, starting from the operating system installation until the loading of the first monitor screen.
Installation options
Based on your convenience, install all the packages yourself on the base OS OR use a pre-packaged OVA.
DIY Installation
In summary:
- Install CentOS or similar.
- Install NTP (chrony)
- Install HTTP server (Optional)
- Install Python 3 and PIP 3
- Python Packages:
- Telegraf
- InfluxDB
- Grafana
- Grafana plugins:
- UTM
Keep reading for detailed step-by-step instructions.
Pre-packaged installation using OVA
The installation and management of this OVA is similar to any other OVA. You can download the OVA from the release page of the UTM project on GitHub. Step-by-step instructions are available below.
DIY Installation
Basic operating system tasks
Install CentOS 7.6
Minimal install should be enough.
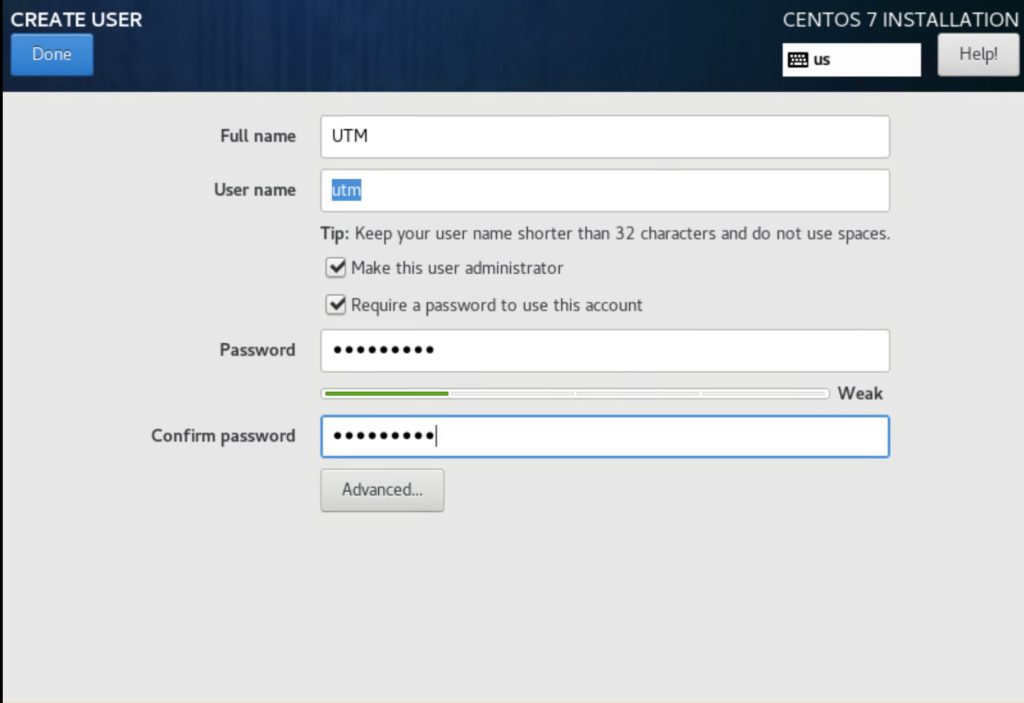
Create a user
The document uses a user: utm, which will be used to run the application. The best place to create a new user is during installation. Do not forget to add the user to the administrator group. See the below screen.
However, if you could not create a new user during installation or forgot to create, you can do so after the installation.
This user should be able to run commands on the system with sudo privileges. If you receive an error like below:
utm is not in the sudoers file. This incident will be reported.resolve the issue by adding the user to wheel group by running below command as root:
usermod -aG wheel utmSetup Internet connectivity
The local machine needs access to the internet to install packages. If you are behind a proxy, add following in /etc/environment file
export http_proxy=http://<proxy-server>:<port>
export https_proxy=http:// <proxy-server>:<port>
export ftp_proxy=http:// <proxy-server>:<port>
export no_proxy=127.0.0.1,localhost
Install packages
sudo yum -y update
sudo yum -y install epel-release vim chrony wget httpd
Configure NTP and timezone
Your UCS servers should be in time sync with the UTM app. Configure the correct time and timezone on the hosting server using the below steps.
Edit /etc/chrony.conf. Comment all the existing servers and add your trusted NTP server:
server <IP_Address_of_NTP_Server>Allow NTP service in firewall (if using)
sudo firewall-cmd --add-service=ntp --permanent
sudo firewall-cmd --reload
Start chronyd service:
sudo systemctl restart chronydConfigure NTP service to start at boot:
sudo systemctl enable chronydVerify the results using: chronyc sources,chronyc tracking and timedatectl commands.
Check existing timezone using timedatectl. If not appropriate, list the available timezones using timedatectl list-timezones and change using timedatectl set-timezone command. (For example, sudo timedatectl set-timezone America/Los_Angeles)
1.1.1.1. Install Python and pip
Install Python 3. This requires the installation of epel-release package. There are many other ways to install Python 3. This is just one of them. Feel free if you have any other preferred approach.
sudo yum -y groupinstall development
sudo yum -y install python36 python36-pip
Installing packages and applications
Install UCSMSDK
sudo python3 -m pip install ucsmsdkInstall NetMiko
sudo python3 -m pip install netmikoDownload and install Grafana
Download and installation instructions for Grafana are very well described on the official website. Please refer to the official installation documentation and the official download page. In short:
Download and install grafana-server
wget -e use_proxy=yes -e https_proxy=<proxy> https://dl.grafana.com/oss/release/grafana-6.3.2-1.x86_64.rpm
sudo yum -y localinstall grafana-6.3.2-1.x86_64.rpm
The above output is just an example. Please refer to the UTM release notes for a recommended version.
Enable service-side rendering
sudo yum -y install fontconfig freetype* urw-fontsStart Grafana-server and enable to start at boot
sudo systemctl start grafana-server
sudo systemctl enable grafana-server
Allow Grafana in firewall
sudo firewall-cmd --zone=public --add-port=3000/tcp --permanent
sudo firewall-cmd --reload
At this time, you should be able to load Grafana. Open a web browser and try to connect to the server_ip_address:3000.
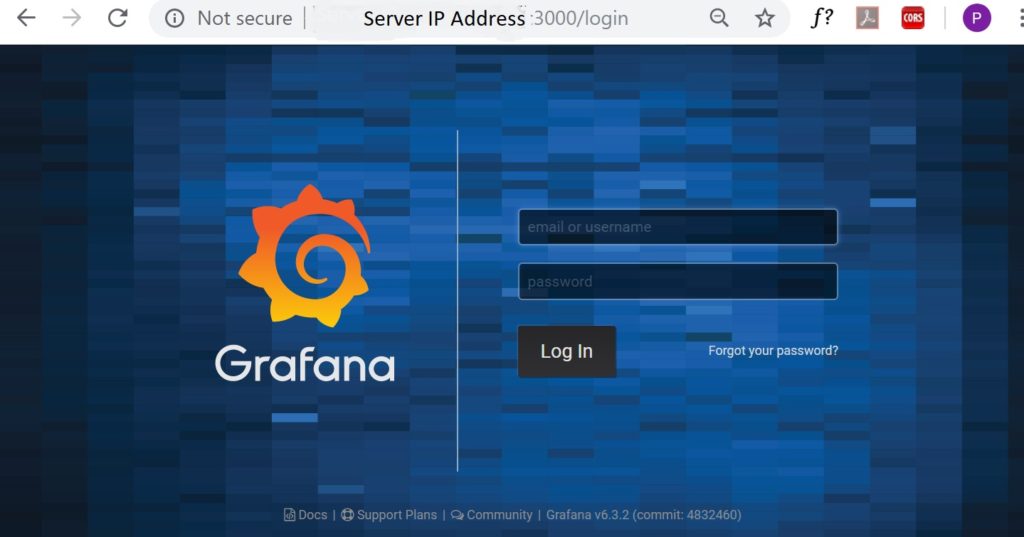
The default login credentials are admin/admin. You will be asked to change the password after the first login.
Download and install InfluxDB
Download and installation instructions for InfluxDB are very well described on the official download page. In short:
Download and install InfluxDB
wget -e use_proxy=yes -e https_proxy=proxy-wsa.esl.cisco.com:80 https://dl.influxdata.com/influxdb/releases/influxdb-1.7.7.x86_64.rpm
sudo yum -y localinstall influxdb-1.7.7.x86_64.rpm
The above output is just an example. Please refer to the UTM release notes for a recommended version.
Enable InfluxDB to start at startup and start it now.
sudo systemctl enable influxdb
sudo systemctl start influxdb
Enable InfluxDB ports in firewall
sudo firewall-cmd --zone=public --add-port=8086/tcp --permanent
sudo firewall-cmd --zone=public --add-port=8088/tcp --permanent
sudo firewall-cmd --reload
Test the installation by connecting to InfluxDB and listing the databases
$ influx -precision rfc3339
Connected to http://localhost:8086 version 1.7.7
InfluxDB shell version: 1.7.7
> show databases
name: databases
name
----
_internal
>
Download and install Telegraf
This is very similar to download and installation of Grafana and InfluxDB
wget -e use_proxy=yes -e https_proxy=proxy-wsa.esl.cisco.com:80 https://dl.influxdata.com/telegraf/releases/telegraf-1.11.4-1.x86_64.rpm
sudo yum -y localinstall telegraf-1.11.4-1.x86_64.rpm
sudo systemctl enable telegraf
sudo systemctl start telegraf
The above output is just an example. Please refer to the UTM release notes for a recommended version.
Verify the installation and functioning of telegraf by checking that a new database with name telegraf has been created in influxdb.
$ influx -precision rfc3339
Connected to http://localhost:8086 version 1.7.7
InfluxDB shell version: 1.7.7
> show databases
name: databases
name
----
_internal
telegraf
> use telegraf
Using database telegraf
> show measurements
name: measurements
name
----
cpu
disk
diskio
kernel
mem
processes
swap
system
>
Telegraf monitors some metrics by default which are captured in the shown measurements (Measurement is similar to a table in a relational databse like MySQL).
Verify Grafana and InfluxDB connection
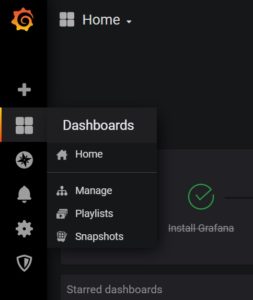
Go to Grafana web interface.
Add a new data source by going to Configuration > Data sources.
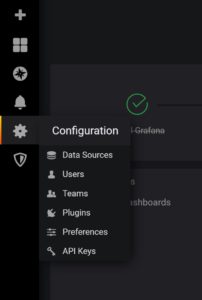
Click on Add data sources
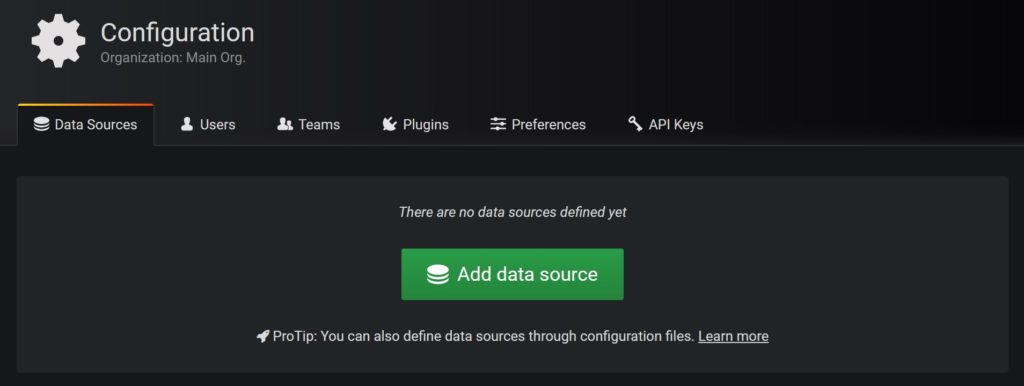
Select InfluxDB from the available options. (Type influx in the search bar). Change following values:
Name: InfluxDB
URL: http://localhost:8086
Database: telegraf
Accept default values for other items.
Click on Save and Test at the bottom on the page to verify connectivity
Note: Telegraf creates a database with name telegraf by default.
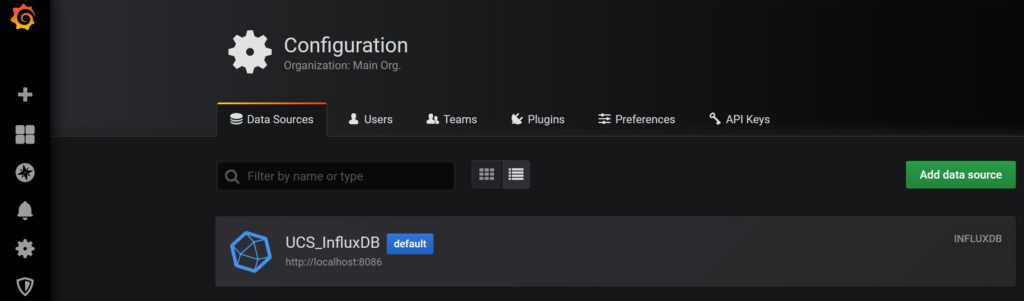
Finally, The Data Sources should look like:
Verification
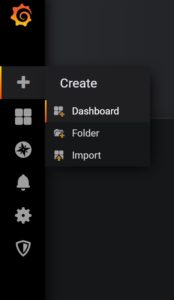
Now, create a test dashboard. Under Create, click on Dashboard
Click on Add Query under the New Panel.
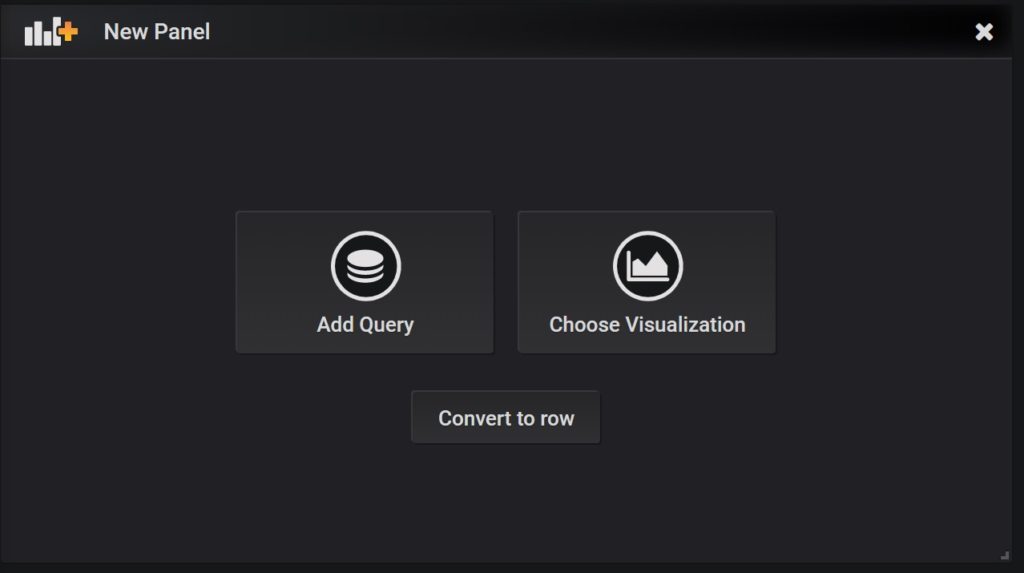
Click on ‘Select measurement’ to select cpu. Click on field to select usage_system. Verify that graph is populated with the values.
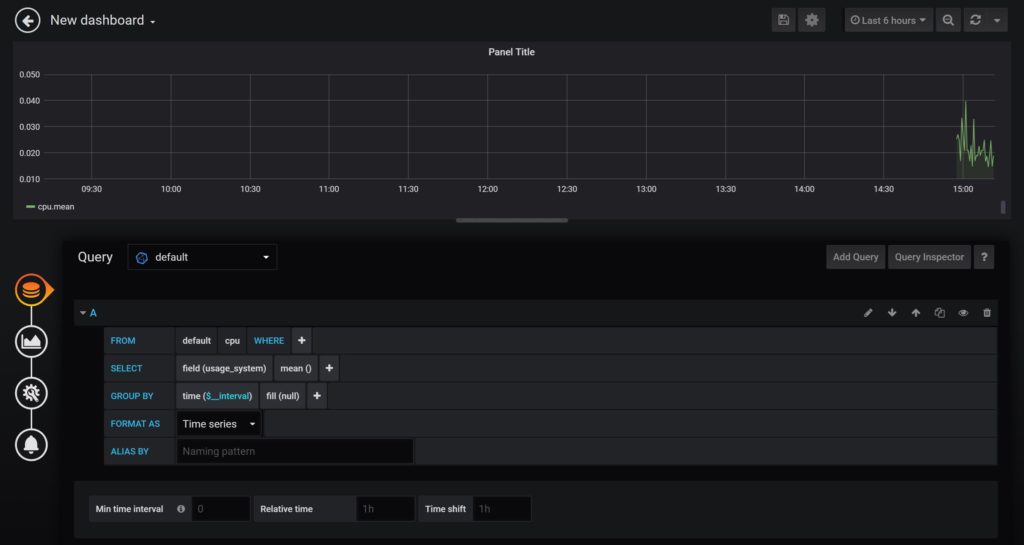
The shown measurements and fields are automatically created by telegraf by default. I have not added any measurements, tags or fields to InfluxDB yet.
Verification is successful if the graph is shown. If not, do not proceed further. If successful, remove the test dashboard. You are free to keep it as your playground.
Verification of connection to Cisco UCS
UTM uses XML APIs and SSH for Cisco UCS monitoring. This section provides verification steps to connect to a Cisco UCS domain. This section is not mandatory but highly recommended, especially if you are setting up the connection for the first time or new to UCSMSDK.
Verification using Python UCSM SDK
UCSMSDK provides a Python-based wrapper on XML APIs. Before using it in the app, let’s verify the underlying connectivity by following steps:
- Open Python interpreter and import relevant package from ucsmsdk.
- Create a connection handle using the UCS domain IP address, username and password.
- Make a login attempt to the UCS domain. Verify that the returned value is True. Returned value of False means that login attempt failed.
- Pull stats from UCS domain. In the below example,
adaptorVnicStatsclass is queried. - The output of this class may be large. For verification, print one item of the returned stats from UCS domain.
- Finally, logout from the UCS domain and quit the python interpreter.
$ python3.6
Python 3.6.8 (default, May  2 2019, 20:40:44)
[GCC 4.8.5 20150623 (Red Hat 4.8.5-36)] on linux
Type "help", "copyright", "credits" or "license" for more information.
>>> from ucsmsdk.ucshandle import UcsHandle
>>> handle = UcsHandle('','','')
>>> handle.login()
True
>>> obj = handle.query_classid(class_id='adaptorVnicStats')
>>> for item in obj:
...  print(item)
...  break
...

Managed Object                  :       AdaptorVnicStats
--------------
class_id                        :AdaptorVnicStats
bytes_rx                        :802656492
bytes_rx_delta                  :26540
bytes_rx_delta_avg              :25702
bytes_rx_delta_max              :26674
bytes_rx_delta_min              :23895
bytes_tx                        :3583631
bytes_tx_delta                  :0
bytes_tx_delta_avg              :75
bytes_tx_delta_max              :162
bytes_tx_delta_min              :0
child_action                    :None
dn                              :sys/chassis-1/blade-1/adaptor-1/host-eth-1/vnic-stats
dropped_rx                      :0
dropped_rx_delta                :0
dropped_rx_delta_avg            :0
dropped_rx_delta_max            :0
dropped_rx_delta_min            :0
dropped_tx                      :0
dropped_tx_delta                :0
dropped_tx_delta_avg            :0
dropped_tx_delta_max            :0
dropped_tx_delta_min            :0
errors_rx                       :0
errors_rx_delta                 :0
errors_rx_delta_avg             :0
errors_rx_delta_max             :0
errors_rx_delta_min             :0
errors_tx                       :0
errors_tx_delta                 :0
errors_tx_delta_avg             :0
errors_tx_delta_max             :0
errors_tx_delta_min             :0
intervals                       :58982460
packets_rx                      :3780047
packets_rx_delta                :135
packets_rx_delta_avg            :123
packets_rx_delta_max            :135
packets_rx_delta_min            :109
packets_tx                      :40976
packets_tx_delta                :0
packets_tx_delta_avg            :0
packets_tx_delta_max            :2
packets_tx_delta_min            :0
rn                              :vnic-stats
sacl                            :None
status                          :None
suspect                         :no
thresholded                     :
time_collected                  :2019-08-10T20:15:25.305
update                          :65539

>>> handle.logout()
True
>>> quit()
Verification of SSH session using Netmiko
UTM also uses SSH session to execute some CLIs. Read here if you want to know why it is required to complete Cisco UCS monitoring. The application also connects to a UCS domain via SSH to execute some CLI commands. This application used Netmiko Python library to connect to Cisco UCS fabric interconnects. Before using it in the app, let’s verify the underlying connectivity by following steps:
- Open Python interpreter and import relevant package from netmiko.
- Connect to UCS domain using IP address, username and password.
- Verify that the connection has been made to the expected system by checking the prompt which shows the system name and executing
show versioncommand. - Connect to the NXOS mode on fabric interconnect A and verify the output of show version command.
- Finally, exit from the UCS domain and python interpreter.
$ python3.6
Python 3.6.8 (default, May  2 2019, 20:40:44)
[GCC 4.8.5 20150623 (Red Hat 4.8.5-36)] on linux
Type "help", "copyright", "credits" or "license" for more information.
>>> from netmiko import ConnectHandler
>>> handle = ConnectHandler(device_type='cisco_nxos',host='',username='',password='')
>>> handle.find_prompt()
'FI6248-28-A#'
>>> handle.send_command('show version',expect_string='#')
'System version: 3.2(3c)'
>>> handle.send_command('connect nxos a',expect_string='#')
'Cisco Nexus Operating System (NX-OS) SoftwarenTAC support: http://www.cisco.com/tacnCopyright (c) 2002-2018, Cisco Systems, Inc. All rights reserved.nThe copyrights to certain works contained in this software arenowned by other third parties and used and distributed undernlicense. Certain components of this software are licensed undernthe GNU General Public License (GPL) version 2.0 or the GNUnLesser General Public License (LGPL) Version 2.1. A copy of eachnsuch license is available atnhttp://www.opensource.org/licenses/gpl-2.0.php andnhttp://www.opensource.org/licenses/lgpl-2.1.phpn'
>>> handle.find_prompt()
'FI6248-28-A(nxos)#'
>>> handle.send_command('show version',expect_string='#')
'Cisco Nexus Operating System (NX-OS) SoftwarenTAC support: http://www.cisco.com/tacnDocuments: http://www.cisco.com/en/US/products/ps9372/tsd_products_support_series_home.htmlnCopyright (c) 2002-2018, Cisco Systems, Inc. All rights reserved.nThe copyrights to certain works contained herein are owned bynother third parties and are used and distributed under license.nSome parts of this software are covered under the GNU PublicnLicense. A copy of the license is available atnhttp://www.gnu.org/licenses/gpl.html.nnSoftwaren  BIOS:      version 3.6.0n  loader:    version N/An  kickstart: version 5.0(3)N2(3.23b)n  system:    version 5.0(3)N2(3.23b)n  power-seq: Module 1: version v5.0n             Module 3: version v2.0n  uC:        version v1.2.0.1n  SFP uC:    Module 1: v1.1.0.0n  BIOS compile time:       05/09/2012n  kickstart image file is: bootflash:///installables/switch/ucs-6100-k9-kickstart.5.0.3.N2.3.23b.binn  kickstart compile time:  5/10/2018 7:00:00 [05/10/2018 07:08:50]n  system image file is:    bootflash:///installables/switch/ucs-6100-k9-system.5.0.3.N2.3.23b.binn  system compile time:     5/10/2018 7:00:00 [05/10/2018 10:24:22]nnnHardwaren  cisco UCS 6248 Series Fabric Interconnect ("O2 32X10GE/Modular Universal Platform Supervisor")n  Intel(R) Xeon(R) CPU         with 16535716 kB of memory.n  Processor Board ID FOC17021PMJnn  Device name: FI6248-28-An  bootflash:   31266648 kBn  SSD model: UGBA1SPD32H0S1-CSC-CIDn  SSD firmware version: 2030nnKernel uptime is 123 day(s), 4 hour(s), 1 minute(s), 17 second(s)nnLast reset at 321576 usecs after  Tue Apr  9 09:37:13 2019nn  Reason: Reset Requested by CLI command reloadn  System version: 5.0(3)N2(3.23b)n  Service: nnpluginn  Core Plugin, Ethernet Plugin, Fc Plugin, Virtualization Pluginn'
>>> handle.send_command('exit',expect_string='#')
''
>>> handle.send_command('exit',expect_string='#')
>>> quit()
Metric Polling from Cisco UCS domain
The data pull logic from Cisco UCS domain is coded in ucs_traffic_monitor.py. This file carries the core logic of Cisco UCS monitoring and can be downloaded from GitHub.
Verification of ucs_traffic_monitor.py
Create /usr/local/telegraf directory.
sudo mkdir /usr/local/telegrafChange the ownership of this folder to telegraf user and wheel group. The telegraf service is run by telegraf user. The ownership change will ensure that the script invocation does not fail due to permission issues. Adding wheel group will help the utm user to make the changes interactively.
sudo chown telegraf:wheel /usr/local/telegrafAlso, add write access to the wheels group. Verify the ownership change
$ pwd
/usr/local
$ ls -lrt
drwxr-xr-x. 2 telegraf wheel  6 Nov 12 10:27 telegraf
$
$ sudo chmod 775 /usr/local/telegraf
$ ls -lrt
drwxrwxr-x. 2 telegraf wheel  59 Nov 10 08:03 telegraf
Copy the ucs_traffic_monitor.py and ucs_domains.txt to /usr/local/telegraf/ directory and
- Change the ownership to the user telegraf so that telegraf service can read and execute ucs_traffic_monitor.py. Read-only access to ucs_domains.txt is enough.
- Provide read, write and execute permissions to the other users in the group to file ucs_traffic_monitor.py. This will help to make and test changes by user utm or root.
- Provide read and write privileges to other users in the group to file ucs_domains.txt. This will help to add or remove UCS domains by user utm or root.
$ pwd
/usr/local/telegraf
$
$ sudo chown telegraf:wheel *
$ ls -lrt
total 84
-rw-rw----. 1 telegraf wheel   483 Nov 10 07:31 ucs_domains.txt
-rwxrwxr--. 1 telegraf wheel 80040 Nov 10 08:01 ucs_traffic_monitor.py
$
$ sudo chmod 660 ucs_domains.txt
$ sudo chmod 774 ucs_traffic_monitor.py
$ ls -lrt
total 84
-rwxrwxr--. 1 telegraf root 80338 Nov 10 07:31 ucs_traffic_monitor.py
-rw-rw----. 1 telegraf root   483 Nov 10 07:31 ucs_domains.txt
$
Next, execute ucs_traffic_monitor.py.
$ python3 /usr/local/telegraf/ucs_traffic_monitor.py -h
usage: ucs_traffic_monitor.py [-h] [-V] [-dss] [-v] [-vv] [-vvv]
                              input_file {dict,influxdb-lp}

Pull stats from Cisco UCS domain and print output in different formats
like InfluxDB Line protocol

positional arguments:
  input_file            file containing the UCS domain information in the
                        format: IP,user,password
  {dict,influxdb-lp}    specify the output format
The input arguments
The file needs two mandatory arguments:
Input_file: File containing the UCS domain access details in the format: IP,user,password . Multiple entries can exist on new lines. Lines starting with # are ignored. Here is a sample file with name ucs_domains.txt.
$ cat /tmp/ucs_domains.txt
# Add new domain in format:IP_Address,username,password
# Add comma between items
# Do not leave whitespaces between items
# Do not leave an empty line
# Lines starting with # are ignored
# Text between [] is location. At least one location is mandatory.
[US]
IP_address,ro_user,password
[UK]
IP_address,ro_user,password
[Italy]
IP_address,ro_user,password
[China]
IP_address,guest,password
#1.1.1.1,guest,abc
The application groups based on geographic location. Hence, it is important that you specify the IP address of the UCS domains under the correct location. The location string can be anything that needs to be properly decoded and represented by a front-end GUI like Grafana. The location is not automatically decoded. For example, if you say US, UTM doesn’t automatically figure out where exactly is the US. An external logic is needed to make that work.
Added on 1/25/2022: Make sure to specify at least one location. This has become one of a simple yet frequent overlook. Without at least one location, you will run into an issue like this.
Output format: The output format can be in a dictionary format (dict) or InfluxDB Line Protocol (influxdb-lp).
Execute the file in verification mode with maximum verbosity.
$ python3.6 /tmp/ucs_traffic_monitor.py /tmp/ucs_domains.txt dict -V -vvvThe execution may take tens of seconds. No output is expected. Notice that the current directory will have two new files.
$ ls -lrt
total 104
-rwxrwxr--. 1 telegraf wheel 80053 Nov 10 08:27 ucs_traffic_monitor.py
-rw-rw----. 1 telegraf wheel   410 Nov 10 08:32 ucs_domains.txt
-rw-rw-r--. 1 utm      utm    2678 Nov 10 08:36 ucs_traffic_monitor_ucs_domains.pickle
-rw-rw-r--. 1 utm      utm   12865 Nov 10 08:36 ucs_traffic_monitor_ucs_domains.log
The first is a pickle file which is used to store the session details. Even though there is no time advantage observed in test environment when doing re-login every 60 seconds, it still is a good idea to login just once and re-use the open session every few seconds. The second is a logfile. Open the logfile and verify no errors exist. Every invocation starts the logs with
---------- START ----------and ends with
---------- END ----------To verify further, execute the file without -V option.
$ python3 /usr/local/telegraf/ucs_traffic_monitor.py /usr/local/telegraf/ucs_domains.txt dict -vvvThis will pull the data from the UCS domains listed in ucs_domains.txt and print the output in the dictionary format in the logfile. Open the logfile again to verify the output. The output may be large. A quick verification is ok to proceed. After the verification, delete the pickle and logfile. The telegraf service is run by user telegraf. It is best that the same user creates (via the service) and owns the pickle file. The logs files are programmed to be stored under /var/log/telegraf directory. The local directory is only a fallback option if something goes wrong with /var/log/telegraf. Refer to the next section to make these changes in telegraf.conf file.
Verification and configuration of Telegraf
The final verification is required by executing the file by telegraf. Stop the telegraf service (if already running) and verify the status.
$ sudo systemctl stop telegraf
$ sudo systemctl status telegraf
● telegraf.service - The plugin-driven server agent for reporting metrics into InfluxDB
   Loaded: loaded (/usr/lib/systemd/system/telegraf.service; enabled; vendor preset: disabled)
   Active: inactive (dead) since Sat 2019-08-10 21:26:11 PDT; 4s ago
     Docs: https://github.com/influxdata/telegraf
  Process: 13188 ExecStart=/usr/bin/telegraf -config /etc/telegraf/telegraf.conf -config-directory /etc/telegraf/telegraf.d $TELEGRAF_OPTS (code=exited, status=0/SUCCESS)
 Main PID: 13188 (code=exited, status=0/SUCCESS)

Aug 10 14:57:11 stg-tme-lnx-6 telegraf[13188]: 2019-08-10T21:57:11Z I! Starting Telegraf 1.11.4
Aug 10 14:57:11 stg-tme-lnx-6 telegraf[13188]: 2019-08-10T21:57:11Z I! Loaded inputs: mem processes swap system cpu disk diskio kernel
Aug 10 14:57:11 stg-tme-lnx-6 telegraf[13188]: 2019-08-10T21:57:11Z I! Loaded aggregators:
Aug 10 14:57:11 stg-tme-lnx-6 telegraf[13188]: 2019-08-10T21:57:11Z I! Loaded processors:
Aug 10 14:57:11 stg-tme-lnx-6 telegraf[13188]: 2019-08-10T21:57:11Z I! Loaded outputs: influxdb
Aug 10 14:57:11 stg-tme-lnx-6 telegraf[13188]: 2019-08-10T21:57:11Z I! Tags enabled: host=stg-tme-lnx-6
Aug 10 14:57:11 stg-tme-lnx-6 telegraf[13188]: 2019-08-10T21:57:11Z I! [agent] Config: Interval:10s, Quiet:false, Hostname:"stg-tme-lnx-6...rval:10s
Aug 10 21:26:11 stg-tme-lnx-6 systemd[1]: Stopping The plugin-driven server agent for reporting metrics into InfluxDB...
Aug 10 21:26:11 stg-tme-lnx-6 telegraf[13188]: 2019-08-11T04:26:11Z I! [agent] Hang on, flushing any cached metrics before shutdown
Aug 10 21:26:11 stg-tme-lnx-6 systemd[1]: Stopped The plugin-driven server agent for reporting metrics into InfluxDB.
Hint: Some lines were ellipsized, use -l to show in full.
Edit the /etc/telegraf/telegraf.conf file to make telegraf execute the ucs_traffic_monitor.py file. As the name suggested, telegraf.conf is the configuration file for telegraf. It lists hundreds of input and output plugins supported by telegraf. This application uses exec plugin for data input and influxdb for data output. By default, telegraf outputs data to inflxdb. Hence, no change is required in output plugin section. To change the input exec plugin, search for
[[inputs.exec]]in telegraf.conf. Do not change any existing lines. Add the following lines at the end of the input.exec plugin section and before the next plugin section:
[[inputs.exec]]
   interval = "60s"
   commands = [
       "python3 /usr/local/telegraf/ucs_traffic_monitor.py /usr/local/telegraf/ucs_domains.txt influxdb-lp -vv",
   ]
   timeout = "50s"
   data_format = "influx"
Also, search for logfile and change the following. This should be near the beginning of the file.
  logfile = "/var/log/telegraf/telegraf.log"
  logfile_rotation_max_size = "10MB"
  logfile_rotation_max_archives = 5
Enable network monitoring of the local system by editing /etc/telegraf/telegraf.conf. Uncomment [[inputs.net]] and change the value of ignore_protocol_stats to true.
# # Read metrics about network interface usage
 [[inputs.net]]
#   ## By default, telegraf gathers stats from any up interface (excluding loopback)
#   ## Setting interfaces will tell it to gather these explicit interfaces,
#   ## regardless of status.
#   ##
#   # interfaces = ["eth0"]
#   ##
#   ## On linux systems telegraf also collects protocol stats.
#   ## Setting ignore_protocol_stats to true will skip reporting of protocol metrics.
#   ##
 ignore_protocol_stats = true
#   ##
Save the changes and close the file.
Telegraf Verification
Verify by running the telegraf in test mode. The output may be large. So, collect in another file. Finally, verify that no errors are shown, and the output looks in InfluxDB Line Protocol format. Note: You don’t have to be a master of InfluxDB Line Protocol (yet) and don’t have to verify line by line. But look for any obvious errors.
$ telegraf --test > outputIt is possible that pickle and log file are generated in the local director. Before starting telegraf service, do not forget to delete the files.
$ pwd
/usr/local/telegraf
$ rm -rf *.log *.pickle
After the complete verification, start the telegraf service again and check the status.
$ sudo systemctl start telegraf
$ systemctl status telegraf -l
● telegraf.service - The plugin-driven server agent for reporting metrics into InfluxDB
   Loaded: loaded (/usr/lib/systemd/system/telegraf.service; enabled; vendor preset: disabled)
   Active: active (running) since Sun 2019-11-10 08:52:08 PST; 3min 1s ago
     Docs: https://github.com/influxdata/telegraf
 Main PID: 17710 (telegraf)
   CGroup: /system.slice/telegraf.service
           ├─17710 /usr/bin/telegraf -config /etc/telegraf/telegraf.conf -config-directory /etc/telegraf/telegraf.d
           └─17798 python3 /usr/local/telegraf/ucs_traffic_monitor.py /usr/local/telegraf/ucs_domains.txt influxdb-lp -vvv

Nov 10 08:52:08 stg-tme-lnx-7 systemd[1]: Started The plugin-driven server agent for reporting metrics into InfluxDB.
Nov 10 08:52:08 stg-tme-lnx-7 telegraf[17710]: 2019-11-10T16:52:08Z I! Starting Telegraf 1.12.4
Check the log file (/var/log/telegraf/telegraf.log) and verify no errors are reported. This is the logfile of telegraf service which is different from the logfile of ucs_traffic_monitor.py. Also, check the logfile of ucs_traffic_monitor.py which should be placed in /var/log/telegraf/ucs_traffic_monitor directory and have a filename auto constructed by combining the ucs_traffic_monitor.py and input file name (like ucs_traffic_monitor_ucs_domains.log). Login to influxdb and verify that 6 new measurements have been created.
$ influx -precision rfc3339
Connected to http://localhost:8086 version 1.7.7
InfluxDB shell version: 1.7.7
> show databases
name: databases
name
----
_internal
telegraf
> use telegraf
Using database telegraf
> show measurements
name: measurements
name
----
BackplanePortStats
Servers
FIEnvStats
FIServerPortStats
FIUplinkPortStats
VnicStats
cpu
disk
diskio
kernel
mem
processes
swap
system
>
As an optional verification step, you can also look under FIEnvStats measurement to verify that data is being added correctly.
> select * from FIEnvStats order by time desc limit 10
name: FIEnvStats
time                 domain         fi_id host          load location mem_available mode    model            name            oob_if_ip      serial      sys_uptime total_memory
----                 ------         ----- ----          ---- -------- ------------- ----    -----            ----            ---------      ------      ---------- ------------
2019-08-11T14:41:28Z 172.28.225.20  B     stg-tme-lnx-6 0.47 China    12327         cluster UCS-FI-6248UP    CC7UCS-13       172.28.225.22  SSI2041020F 6134291    16148
2019-08-11T14:41:28Z 172.28.225.20  A     stg-tme-lnx-6 0.65 China    12305         cluster UCS-FI-6248UP    CC7UCS-13       172.28.225.21  SSI204101T1 6134291    16148
2019-08-11T14:41:28Z 172.25.174.41  B     stg-tme-lnx-6 0.15 Italy    27226         cluster UCS-FI-6332-16UP UCSFI6332-17474 172.25.174.76  SAL1937NSFE 25218027   32128
2019-08-11T14:41:28Z 172.25.174.41  A     stg-tme-lnx-6 0.5  Italy    26985         cluster UCS-FI-6332-16UP UCSFI6332-17474 172.25.174.74  SAL1937NSFS 25218027   32128
2019-08-11T14:41:28Z 172.22.163.59  B     stg-tme-lnx-6 0.41 US       13162         cluster UCS-FI-6248UP    FI6248-1        172.22.163.58  SSI15170BX0 41277047   16165
2019-08-11T14:41:28Z 172.22.163.59  A     stg-tme-lnx-6 0.15 US       12916         cluster UCS-FI-6248UP    FI6248-1        172.22.163.57  SSI172807QN 41277047   16165
2019-08-11T14:41:28Z 172.22.163.237 B     stg-tme-lnx-6 0.09 UK       12773         cluster UCS-FI-6248UP    FI6248-28       172.22.163.236 SSI16450F6P 10681072   16148
2019-08-11T14:41:28Z 172.22.163.237 A     stg-tme-lnx-6 0.17 UK       12621         cluster UCS-FI-6248UP    FI6248-28       172.22.163.235 SSI16450F6X 10681072   16148
2019-08-11T14:40:28Z 172.28.225.20  B     stg-tme-lnx-6 0.18 China    12327         cluster UCS-FI-6248UP    CC7UCS-13       172.28.225.22  SSI2041020F 6134232    16148
2019-08-11T14:40:28Z 172.28.225.20  A     stg-tme-lnx-6 0.23 China    12306         cluster UCS-FI-6248UP    CC7UCS-13       172.28.225.21  SSI204101T1 6134232    16148
>
Setting up front-end visualization using Grafana
If you have come this far, you have completed:
- Installation of the required packages.
- Installation of backend database (InfluxDB)
- Installation of front-end monitoring application (Grafana)
- Installation of data input and output application (Telegraf)
- Configuration of telegraf to ingest the input data from Cisco UCS and output to InfluxDB using ucs_traffic_monitor.py file.
InfluxDB should be receiving data from Cisco UCS every 60 seconds by now.
The final step is to pull the data from the database and display on front-end Grafana. But before that, a functional web server is required to act as the source of few files in Grafana.
Update: Setting up a web-server is not required anymore. Please copy UTM images to /usr/share/grafana/public/img/utm directory.
Set-up a web server
This is an optional step to help some of the panels in Grafana dashboard which source images from a webserver. You can choose to delete those panels completely or find an alternate way to supply the images. If you choose to go ahead, here are the steps.
Install HTTP server if not done already
$ sudo yum install httpd -y
Start httpd server and check the status.
$ sudo systemctl start httpd
$ sudo systemctl enable httpd
$ sudo systemctl status httpd -l
● httpd.service - The Apache HTTP Server
   Loaded: loaded (/usr/lib/systemd/system/httpd.service; disabled; vendor preset: disabled)
   Active: active (running) since Sun 2019-08-11 08:41:31 PDT; 6s ago
     Docs: man:httpd(8)
           man:apachectl(8)
 Main PID: 11835 (httpd)
   Status: "Processing requests..."
   CGroup: /system.slice/httpd.service
           ├─11835 /usr/sbin/httpd -DFOREGROUND
           ├─11836 /usr/sbin/httpd -DFOREGROUND
           ├─11837 /usr/sbin/httpd -DFOREGROUND
           ├─11838 /usr/sbin/httpd -DFOREGROUND
           ├─11839 /usr/sbin/httpd -DFOREGROUND
           └─11840 /usr/sbin/httpd -DFOREGROUND

Aug 11 08:41:31 stg-tme-lnx-6 systemd[1]: Starting The Apache HTTP Server...
Aug 11 08:41:31 stg-tme-lnx-6 systemd[1]: Started The Apache HTTP Server.
Allow HTTP service by firewall
$ sudo firewall-cmd --add-service=http --permanent
$ sudo firewall-cmd --reload
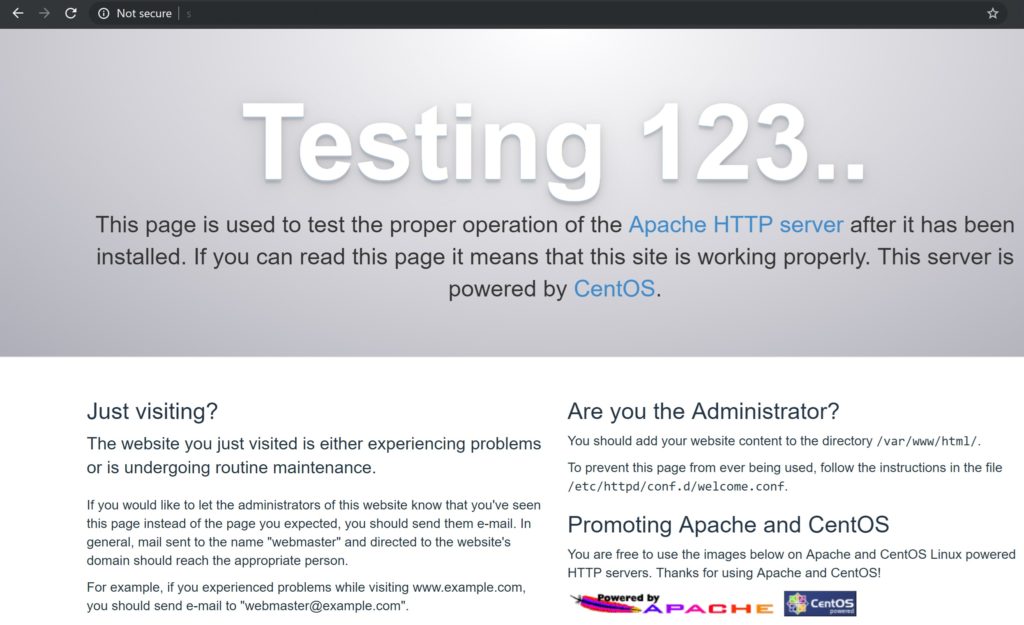
Open a browser and point it to the IP address or DNS name of your server. A test page should be displayed which verifies the successful installation of your web server.
Copy the world_map.png, your_logo.png and cisco_logo.png files to /var/www/html directory. These files are available on GitHub or feel free to create your own.
$ pwd
/var/www/html
$ ls -lrt
total 428
-rw-r--r--. 1 root root 127043 Nov 10 09:00 cisco_logo.png
-rw-r--r--. 1 root root 221492 Nov 10 09:00 world_map.png
-rw-r--r--. 1 root root   4416 Nov 10 09:00 your_logo.png
Verify that the file is displayed in the web browser.
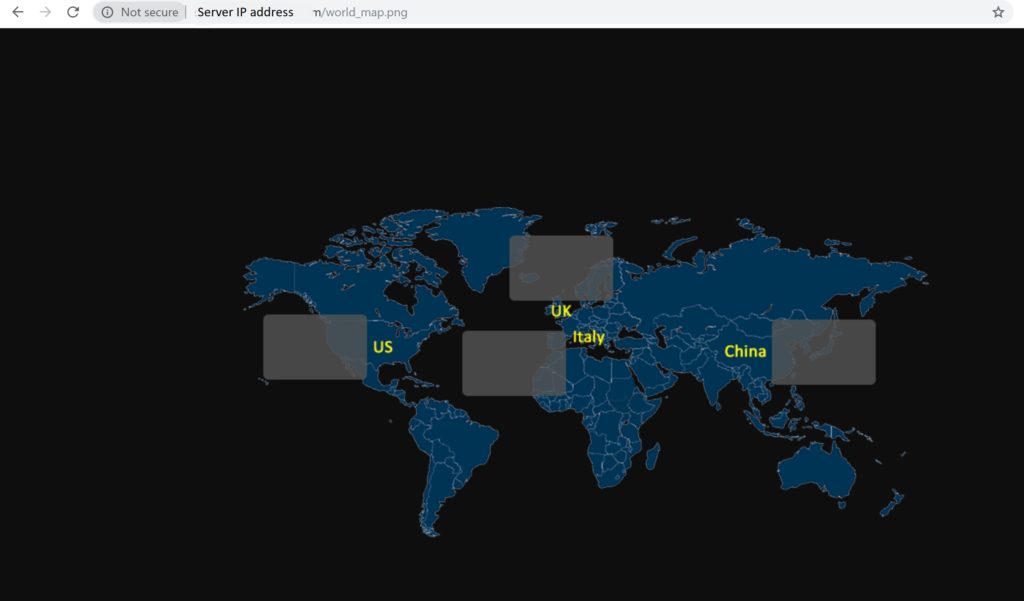
The web server is setup now.
Install Grafana plugins
The next step is to add the required plugins to Grafana. The general process to install a new plugin in Grafana is to download the plugin, unzip the files in /var/lib/grafana/plugins directory and restart the Grafana-server.
Alternatively, you can use the Grafana-cli to install the plugins.
$ grafana-cli plugins list-remote
$ sudo grafana-cli plugins install agenty-flowcharting-panel
$ sudo grafana-cli plugins install grafana-piechart-panel
$ sudo grafana-cli plugins install larona-epict-panel
$ grafana-cli plugins install michaeldmoore-multistat-panelUpdate: Changing disable_sanitize_html = true is not required anymore. You should not change the default behavior.
Some of the panels use Javascript in grafana panel. As per Grafana( as written here): https://community.grafana.com/t/text-html-box-javascript-not-loading/15054
We disabled html in this panel due to security, you enable it again via this server setting:
http://docs.grafana.org/installation/configuration/#disable-sanitize-html 86
Note: If you have any issues with this change, don’t worry. This is a nice-to-have feature. Not making this change will not limit you in any significant way.
Edit /etc/grafana/grafana.ini and add disable_sanitize_html = true.
Restart Grafana-server
$ sudo systemctl restart grafana-server
$ sudo systemctl status grafana-server -l
● grafana-server.service - Grafana instance
   Loaded: loaded (/usr/lib/systemd/system/grafana-server.service; enabled; vendor preset: disabled)
   Active: active (running) since Sun 2019-08-11 09:15:01 PDT; 6s ago
     Docs: http://docs.grafana.org
 Main PID: 14377 (grafana-server)
   CGroup: /system.slice/grafana-server.service
           └─14377 /usr/sbin/grafana-server --config=/etc/grafana/grafana.ini --pidfile=/var/run/grafana/grafana-server.pid --packaging=rpm cfg:default.paths.logs=/var/log/grafana cfg:default.paths.data=/var/lib/grafana cfg:default.paths.plugins=/var/lib/grafana/plugins cfg:default.paths.provisioning=/etc/grafana/provisioning

Aug 11 09:15:01 stg-tme-lnx-6 grafana-server[14377]: t=2019-08-11T09:15:01-0700 lvl=info msg="Initializing ServerLockService" logger=server
Aug 11 09:15:01 stg-tme-lnx-6 grafana-server[14377]: t=2019-08-11T09:15:01-0700 lvl=info msg="Initializing TracingService" logger=server
Aug 11 09:15:01 stg-tme-lnx-6 grafana-server[14377]: t=2019-08-11T09:15:01-0700 lvl=info msg="Initializing UsageStatsService" logger=server
Aug 11 09:15:01 stg-tme-lnx-6 grafana-server[14377]: t=2019-08-11T09:15:01-0700 lvl=info msg="Initializing UserAuthTokenService" logger=server
Aug 11 09:15:01 stg-tme-lnx-6 grafana-server[14377]: t=2019-08-11T09:15:01-0700 lvl=info msg="Initializing CleanUpService" logger=server
Aug 11 09:15:01 stg-tme-lnx-6 grafana-server[14377]: t=2019-08-11T09:15:01-0700 lvl=info msg="Initializing NotificationService" logger=server
Aug 11 09:15:01 stg-tme-lnx-6 systemd[1]: Started Grafana instance.
Aug 11 09:15:01 stg-tme-lnx-6 grafana-server[14377]: t=2019-08-11T09:15:01-0700 lvl=info msg="Initializing provisioningServiceImpl" logger=server
Aug 11 09:15:01 stg-tme-lnx-6 grafana-server[14377]: t=2019-08-11T09:15:01-0700 lvl=info msg="Initializing Stream Manager"
Aug 11 09:15:01 stg-tme-lnx-6 grafana-server[14377]: t=2019-08-11T09:15:01-0700 lvl=info msg="HTTP Server Listen" logger=http.server address=0.0.0.0:3000 protocol=http subUrl= socket=
Do not forget to refresh the web page if Grafana was already open in the browser.
Import dashboards
Open Grafana in a web browser and import the dashboards.
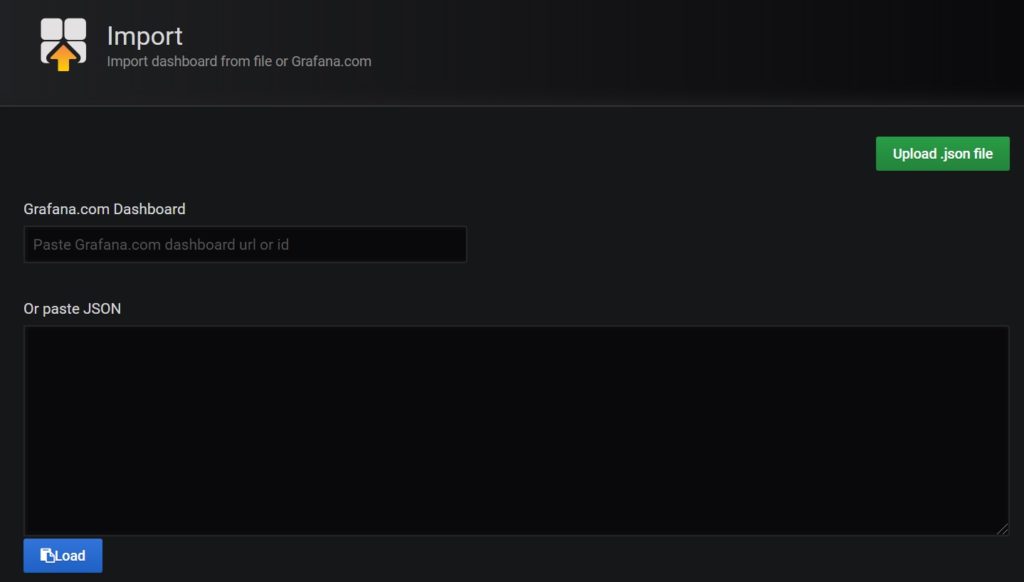
Click on Import on the top left.
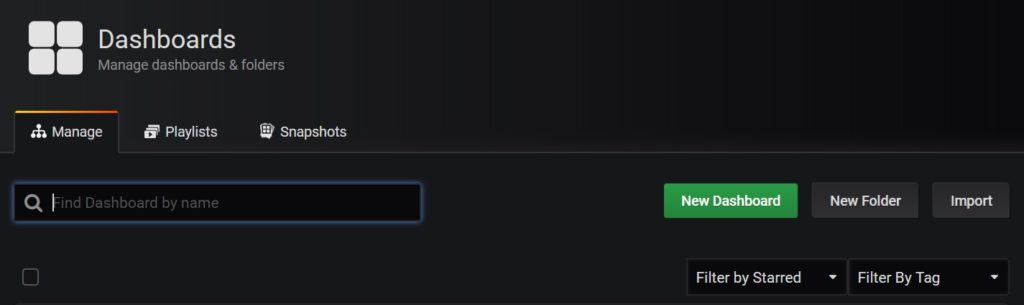
Click on Upload .json file on top left and import the dashboard file.
Import all the supplied dashboards.
Your installation should now be fully functional and ready to monitor Cisco UCS servers. Open the Locations dashboard. Navigate to other dashboards and verify that data is being populated and is correct.
That is all!
Installing UTM using OVA
UTM OVA is similar to any other CentOS based OVA. Download it from the release page of the UTM project on GitHub.
Deploying the UTM OVA using vSphere
In vSphere, select ESXi host, right click > Deploy OVF template…
Note: Try using another browser if it fails. For example, it worked for me using Firefox but failed using Chrome.
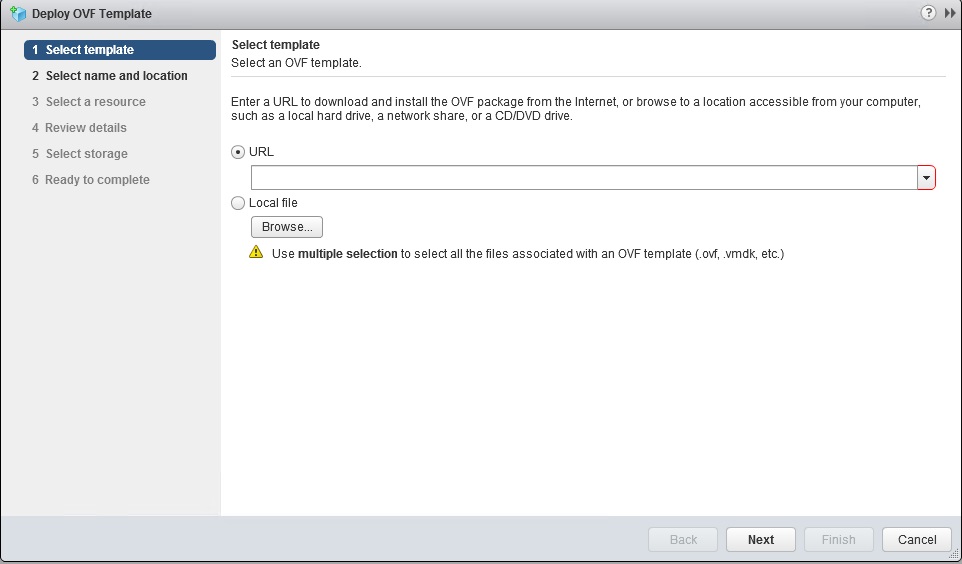
Select Local file, browse the OVA and click Next.
Provide a name for the VM.
Select a Compute (ESXi) host.
In review details, verify the product name and version.
Select a datastore. Prefer SSD storage.
Don’t modify anything on Select network. Click next.
In customize template, enter the values.
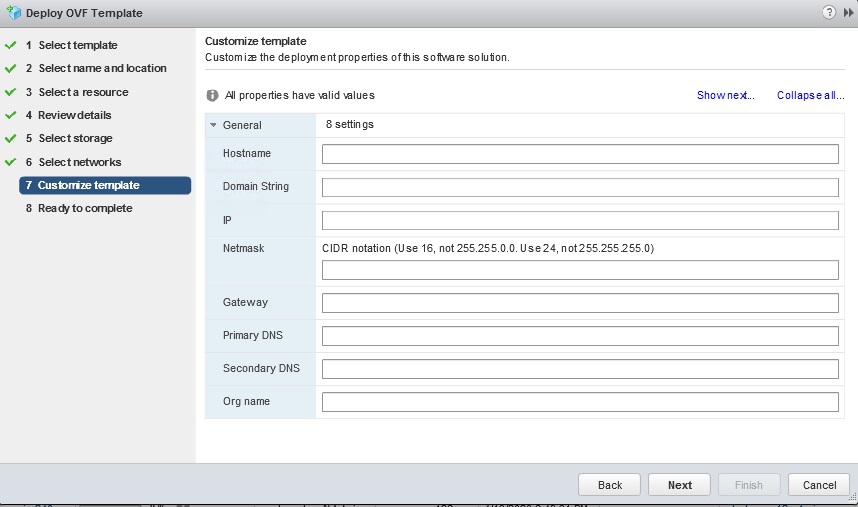
Here are some hints:
- Hostname (ex: utm-host)
- Domain String (ex: cisco.com)
- IP Address (ex: 1.1.1.1)
- Mask (ex: 24)
- Gateway (ex: 1.1.1.254)
- Primary DNS (ex: IP address)
- Secondary DNS (ex: IP address)
- Org Name (Your org name, can be any string. Keep it short)
Note: Do not leave anything blank. If you do, configure the settings using the web console later.
The Org Name is used to display the name on the Grafana dashboards.
Click finish. It will take a while to finish the task due to the large size of the OVA.
Setup after the OVA installation
After the installation, power-on the VM and login. The VM has two accounts:
user:utm
password:Utm_12345
user:root
password:Utm_12345
Login and change password(s)
First things first. Change the passwords of both the accounts after login. Here is an example:
$ passwd
Changing password for user utm.
Changing password for utm.
(current) UNIX password:
New password:
Retype new password:
passwd: all authentication tokens updated successfully.
$
Setup time
It is important to have a time sync between the monitoring UTM and the monitored UCS domains. It is best to use a NTP server to achieve this. Edit /etc/chrony.conf and add your trusted NTP server. For example:
server 1.1.1.1
Restart chrony service.
$ sudo systemctl restart chronydSetup timezone
Check existing timezone using timedatectl command. If not correct, list the available timezones using timedatectl list-timezones
and change using timedatectl set-timezone command. For example:
sudo timedatectl set-timezone America/Los_AngelesKeeping your OVA up-to-date and upgrades
I created an OVA for 0.2 release of UTM but never made it public. Some users got it directly. Others installed via the DIY approach. I also released an OVA based on the 0.3 release of the UTM but I may not create OVA for every subsequent release. It is just too much additional work. The UTM v0.3 OVA is based on CentOS 7.6. It is fine to install UTM using the OVA based on v0.3, but you must upgrade to the latest version right after installing it.
First, get the latest files from the UTM GitHub repo. If the UTM VM can access the Internet, clone the repo directly. This is the easiest approach.
git clone https://github.com/paregupt/ucs_traffic_monitor.gitIf Internet access is not possible, download the zip file and copy it to the UTM VM.
I have written a utility to automate the upgrade of UTM within a few minutes. This can:
- Download and upgrade Grafana
- Download and upgrade Telegraf
- Download and upgrade Grafana plugins
- Upgrades UTM images
- Upgrades UTM receiver
- Take a backup of the existing UTM receiver.
- Upgrades Grafana dashboards.
- Take backup of existing Grafana dashboards.
If the UTM VM can access the Internet, just execute the upgrade_utm.shand follow the instructions.
If access to the Internet is not possible, the instructions to download the dependencies are shown when you execute upgrade_utm.sh. You can still use this upgrade utility to do the rest of the tasks.
The upgrade utility works out-of-the-box when used on the UTM OVA (which I built) or on DIY installation performed using the steps shared here. If you have customized the directory locations, please edit the upgrade_utm.sh accordingly.
Sample upgrade output
$ sudo ./upgrade_utm.sh

---------------------------
Hi there. I am Kiara.
I am 2 years old and I can help you in upgrading your UTM installation.
I learned it with my daddy while he was working on it.
---------------------------

---------------------------
May I continue? (y/n):y
---------------------------
I can upgrade the complete UTM app or just the UI dashboards.
What do you want me to do? (a(ll) for total upgrade, any other key to upgrade UI dashboards only):a
---------------------------
Alright! Let's get started. Upgrading UTM will take just a few minutes.
First, I need some new packages. I can download them if this machine can access the Internet

If this machine can't reach the Internet, please:
  1. Download and install https://dl.grafana.com/oss/release/grafana-7.1.1-1.x86_64.rpm
      1.1. Minimum required version 7.1.1
  2. Download and install https://grafana.com/grafana/plugins/agenty-flowcharting-panel/installation
      2.1. Minimum required version 0.9
  3. Download and install https://grafana.com/grafana/plugins/michaeldmoore-multistat-panel/installation
      3.1. Minimum required version 1.4.1
  4. Restart Grafana: systemctl restart grafana-server
  5. Download and install wget https://dl.influxdata.com/telegraf/releases/telegraf-1.15.1-1.x86_64.rpm
---------------------------

May I access the Internet now? (y to keep me going, n to install them manually):y
---------------------------
Downloading and upgrading Grafana v7.1.1 ...
--2020-07-29 17:05:31--  https://dl.grafana.com/oss/release/grafana-7.1.1-1.x86_64.rpm
Length: 52229765 (50M) [application/x-redhat-package-manager]
Saving to: ‘grafana-7.1.1-1.x86_64.rpm’

100%[==================================================================================================================>] 52,229,765  10.5MB/s   in 4.6s

2020-07-29 17:05:36 (10.7 MB/s) - ‘grafana-7.1.1-1.x86_64.rpm’ saved [52229765/52229765]

Loaded plugins: fastestmirror
Examining grafana-7.1.1-1.x86_64.rpm: grafana-7.1.1-1.x86_64
Marking grafana-7.1.1-1.x86_64.rpm as an update to grafana-6.7.2-1.x86_64
Resolving Dependencies
--> Running transaction check
---> Package grafana.x86_64 0:6.7.2-1 will be updated
---> Package grafana.x86_64 0:7.1.1-1 will be an update
--> Finished Dependency Resolution

Dependencies Resolved

============================================================================================================================================================
 Package                          Arch                            Version                            Repository                                        Size
============================================================================================================================================================
Updating:
 grafana                          x86_64                          7.1.1-1                            /grafana-7.1.1-1.x86_64                          162 M

Transaction Summary
============================================================================================================================================================
Upgrade  1 Package

Total size: 162 M
Downloading packages:
Running transaction check
Running transaction test
Transaction test succeeded
Running transaction
  Updating   : grafana-7.1.1-1.x86_64                                                                                                                   1/2
  Cleanup    : grafana-6.7.2-1.x86_64                                                                                                                   2/2
POSTTRANS: Running script
  Verifying  : grafana-7.1.1-1.x86_64                                                                                                                   1/2
  Verifying  : grafana-6.7.2-1.x86_64                                                                                                                   2/2

Updated:
  grafana.x86_64 0:7.1.1-1

Complete!
Grafana upgrade done

---------------------------
--2020-07-29 17:05:49--  https://dl.influxdata.com/telegraf/releases/telegraf-1.15.1-1.x86_64.rpm
Length: 21085359 (20M) [application/x-redhat-package-manager]
Saving to: ‘telegraf-1.15.1-1.x86_64.rpm’

100%[==================================================================================================================>] 21,085,359  11.1MB/s   in 1.8s

2020-07-29 17:05:50 (11.1 MB/s) - ‘telegraf-1.15.1-1.x86_64.rpm’ saved [21085359/21085359]

Loaded plugins: fastestmirror
Examining telegraf-1.15.1-1.x86_64.rpm: telegraf-1.15.1-1.x86_64
Marking telegraf-1.15.1-1.x86_64.rpm as an update to telegraf-1.14.0-1.x86_64
Resolving Dependencies
--> Running transaction check
---> Package telegraf.x86_64 0:1.14.0-1 will be updated
---> Package telegraf.x86_64 0:1.15.1-1 will be an update
--> Finished Dependency Resolution

Dependencies Resolved

============================================================================================================================================================
 Package                          Arch                           Version                            Repository                                         Size
============================================================================================================================================================
Updating:
 telegraf                         x86_64                         1.15.1-1                           /telegraf-1.15.1-1.x86_64                          67 M

Transaction Summary
============================================================================================================================================================
Upgrade  1 Package

Total size: 67 M
Downloading packages:
Running transaction check
Running transaction test
Transaction test succeeded
Running transaction
  Updating   : telegraf-1.15.1-1.x86_64                                                                                                                 1/2
warning: /etc/telegraf/telegraf.conf created as /etc/telegraf/telegraf.conf.rpmnew
  Cleanup    : telegraf-1.14.0-1.x86_64                                                                                                                 2/2
  Verifying  : telegraf-1.15.1-1.x86_64                                                                                                                 1/2
  Verifying  : telegraf-1.14.0-1.x86_64                                                                                                                 2/2

Updated:
  telegraf.x86_64 0:1.15.1-1

Complete!
Telegraf upgrade done

---------------------------
Downloading and upgrading other packages ...
---------------------------
installing agenty-flowcharting-panel @ 0.9.0
from: https://grafana.com/api/plugins/agenty-flowcharting-panel/versions/0.9.0/download
into: /var/lib/grafana/plugins

✔ Installed agenty-flowcharting-panel successfully

Restart grafana after installing plugins .

flowcharting upgrade done
---------------------------
installing michaeldmoore-multistat-panel @ 1.4.1
from: https://grafana.com/api/plugins/michaeldmoore-multistat-panel/versions/1.4.1/download
into: /var/lib/grafana/plugins

✔ Installed michaeldmoore-multistat-panel successfully

Restart grafana after installing plugins .

multistat upgrade done
---------------------------

---------------------------
Upgrading UTM images ...
Images upgrade done
---------------------------

---------------------------
Upgrading UTM receiver ...
Your existing UTM version is 0.319
First, let me take a backup ...
Done: /usr/local/telegraf/ucs_traffic_monitor_0.319.py
Upgrading UTM receiver ...
Your UTM receiver is now upgraded to version 0.45
---------------------------

---------------------------
In the earlier releases of UTM, disable_sanitize_html flag was enabled. It is not required anymore.
I am turning this off.
Done
---------------------------

Are you ready to upgrade UI dashboards: (y/n)y
---------------------------
I need Grafana Credentials.
Hint:Utm_12345
---------------------------
Grafana User:admin
Password:

---------------------------
First, let's backup your existing UTM dashboards
I have taken a backup of your existing UTM dashboards in /usr/local/telegraf/grafana/dashboards_0517072920
---------------------------
Now, I will try to upgrade UTM dashboards.
Are you sure: (y/n)y
Upgrading chassis_pause             -- in Folder 1   -- with ID 2   -- to UTM version 4
.
Upgrading service_profile           -- in Folder 1   -- with ID 9   -- to UTM version 4
.
Upgrading domain_overview           -- in Folder 1   -- with ID 4   -- to UTM version 4
.
Upgrading domain_traffic            -- in Folder 1   -- with ID 5   -- to UTM version 4
.
Upgrading chassis_traffic           -- in Folder 1   -- with ID 3   -- to UTM version 4
.
Upgrading local_sys                 -- in Folder 1   -- with ID 7   -- to UTM version 4
.
Upgrading locations                 -- in Folder 1   -- with ID 8   -- to UTM version 4
.
Upgrading ingress_congestion        -- in Folder 1   -- with ID 6   -- to UTM version 4
.
Done

UTM dashboards upgraded
---------------------------
Update home dashboard to ID 8 ...
{"message":"Preferences updated"}
That is all.
---------------------------
...
---------------------------
Bye - Kiara.
---------------------------$
A note on manual upgrade of Grafana dashboards
The latest grafana dashboard JSON files are under grafana/dashboards directory. Be careful in manually importing the new version of the dashboards. All the dashboards have a unique UID. If you change this, hyperlinking between the dashboards will break. If you overwrite the existing dashboard, your custom changes will be lost. One of the approaches is:
- Take backup of your custom dashboards before upgrade.
- Overwrite your dashboard with the latest version.
- Edit your custom dashboards in a text editor and change the UID.
- Import your custom dashboards into Grafana.
- Copy the panels from your custom dashboards to latest dashboards.
You can flip the above sequence by keeping your customer dashbaord and importing from the latest version only that is required. Due to the flexibility, it is hard to generalize it. There may be better approaches.
Add UCS domains
The last step is to add IP address and read-only credentials of your UCS domains in /usr/local/telegraf/ucs_domains_group_1.txt or
/usr/local/telegraf/ucs_domains_group_2.txt
At least one location is mandatory. Also, you should give some thought in properly grouping the UCS domains for better monitoring experience.
Added on 1/25/2022: Make sure to specify at least one location. This has become one of a simple yet frequent overlook. Without at least one location, you will run into an issue like this.
These files are already invoked by telegraf. Hence, you do not need to restart telegraf service. But if you choose to add more input files and add those files to telegraf, please do not forget to restart telegraf service.
Note: The conf file of telegraf is located at /etc/telegraf/telegraf.conf.
Wait 60 seconds and check logs at /var/log/telegraf/telegraf.log and /var/log/telegraf/ucs_traffic_monitor/ for any errors.
Monitoring UCS using Grafana
Open Grafana in your web browser by pointing it to <IP_address_of_UTM>:3000. Login using:
user:admin
password:Utm_12345
Change this password.
Wait for 2 mins. That’s it.
Cheers!
Nice Article
Best regarsd,
Arnaud
Thanks Arnaud. You are doing great work on the Grafana Flow Charting plugin.
Hi, great tool.
Can you provide me with a CentOS 7.6-based OVA that already contains all of the packages? Thank you
Glad you asked. I have updated the post with OVA details.
Excellent article and step by step guide. I’ve successfully gotten several UCS systems monitored using standalone 6148 FIs and chassis but when when trying to poll UCS mini’s with 6324 internal FIs the script fails to write to Influx. Haven’t started debuging the results, but from watching a tcpdump it is polling the end device. But, with any of these 6324s it causes all other nodes to fail to write that are in inventory.
Hi Todd, First, try the latest version from https://github.com/paregupt/ucs_traffic_monitor. I have a lot of additional debugging. Second, try it out manually outside the telegraf. If nothing helps, I can take a look. Please keep me posted. You can also raise issues in GitHub: https://github.com/paregupt/ucs_traffic_monitor/issues
What an excellent use of Grafana etc. Not only eye-candy to please management but also a useful tool for the engineers! Now that your UCS script also works with UCS mini’s my world is complete :o)
Excellent work Paresh!
Hi!
I have UTM working with my 6454 FIs running 4.0(4e). It is absolutely wonderful!
I am having trouble with my:
6296UP UCSM: 3.2(3h)A FW: 5.0(3)N2(3.23e)
Since this was python 2 was released while 3.2(3h) was released, I had tried using “python2.7 /usr/local/telegraf/ucs_traffic_monitor.py /usr/local/telegraf/ucs_domains.txt influxdb-lp -vv”
I get [inputs.exec] Error in plugin: metric parse error: expected field at 114:193: “VnicStats,domain=[…] in telegraf.log and no metrics in db.
In the working_fi_model_and_ucsm_version.md it lists
UCS-FI-6248UP 3.2(3c) 5.0(3)N2(3.23b)
so I would think 3.2(3h) would also work.
Has anyone gotten an older FI/UCSM to work with this?
Hi Bill
FI 62xx should work. There are many production deployments running with it. Are you using Python 2? Given its limited life span, I did not code UTM for Python 2. If using Python 3 not an option, code needs to be changed to be compabilble with Python 2.
Hi Paresh,
I just tried python2 in that one [[inputs.exec]] section, just in case it would work with UCSM 3.2(3h). It did not and I set it back to python3. Python3 is used in my other two [[inputs.exec]] sections and works fine.
Looking at telegraf.log, I see these, once per minute:
Looking into the
I see:
The rack-unit-x would be our HyperFlex nodes (HX240c M4SX).
Running:
seems to complete and dumps a ton of data to screen. No python errors. I do see the rack-unit output:
I saw in Issue 13 on git-hub you mentioned adding support for C series, wondering if this is related. I am running 0.4 of ucs_traffic_monitor.py Sorry this post is so long. And thank you for this awesome project!
Bill, UTM is written for Python 3 only. As you mentioned, its working fine with it. Curious to know, why are you trying to make it work with Python 2 while Python 3 is working?
Issue#13 is different.
I only TRIED to use P2 since it failed with P3. I am not trying to make it work with P2, it was just a desperate attempt to get the 6296UP with 3.2(3h)A to work. It failed and I have reverted back to P3 and have no plans to use P2. The problem is:
Unable to decode peer_dn:, dn:sys/rack-unit-1/adaptor-1/host-eth-3
This is output from P3 in telegraf.log
Ah, that explains. You can safely rule out issues with the Python version. In the previous comment, you mentioned that the Running: python3…seems to complete and dumps a ton of data to screen. This is expected and an indication that it is working fine. BTW,
is just an INFO, not an error.
Great App! Really obliged.
There are two math() formulas you have used in your query.
1. (“bytes_rx_delta”) *8*1.1/[[polling_interval]]
2. (“bytes_rx_delta”) *8/ [[polling_interval]]/( [[__interval_ms]] / ( [[polling_interval]] * 1000) )
how did you come up with this formula? I appreciate your elaborate answer.
Can you please share the complete query and also the exact location? I can confirm after understanding the context. Overall, the [[polling_interval]] provides rate in seconds. The metrics are polled every polling_interval (60secs). Dividing the bytes_rx_delta by 60 gives value in Bytes/sec. *8 converts it into bites/sec. The multiplication of 1.1 is there to prevent the overlapping of the graphs, which I can confirm after you share the exact location of this query.
The 2nd formula involving __interval_ms normalized the values when the selected duration is long. Grafana automatically calculates the __interval and makes it longer when the selected duration is long. The backend database has metrics at 60 seconds granularity. The sum function counts the values multiple times which can be prevented by dividing [[__interval_ms]]. Again, I can provide a better explanation if you share the exact query you are looking at.
Nice work.
In Grafana how can I present a chart with a composite metric, e.g. the aggregated traffic of two uplink port?
You can check for the interfaces in the graph query. For example
You can modify this query to
Notice the additional check for port
AND port =~ /1\/15|1\/14/to plot graphs for ports 1/15 and 1/4 only.First of all thanks to Paresh for enabling this setup.
i am hitting same issue with UTM(OVA template) or manual setup.
it’s not loading the metrics in telegraf and Grafana not showing the reports.
No errors when we called manually and I am using python3.
UCSM version: 3.2(3o)
2.2(8m)
series: UCS-FI-6296UP
2020-08-22T23:12:14Z E! [inputs.exec] Error in plugin: metric parse error: expected field at 1:62: “FIEnvStats,domain
Appreciate if we have solution .
Hi Narayanan
Are you using the latest? If not, After deploying from the OVA, please update to the latest. The instructions are provided above.
If you still see the issue, you may want to open a new issue on the GitHub repo with detailed logs. Unfortunately, the logs are truncated.
Cheers!
Hello Paresh,
I would like to thank you for this project and the OVA you provide. It seems to be the solution I’m looking for, for quite some time.
But there is one thing, I don’t understand yet. I deployed the OVA and updated it to the latest release 0.4 two days ago. Now, I ran an iperf3 test for the duration of 4 minutes from VM1 to VM2. VM1 and VM2 are running on two different ESXi-Hosts (Blades). Both blades are in the same chassis. IPerf showed a bandwith of round about 7.3 Gbit/s. The perfomance charts in vSphere-Client shows the same for the ESXi the VM is running on. I would expect to see the same 7.3 Gbit/s in the UTM Grafana dasboard ‘Server Traffic’ for the corresponding service profile. But instead the curve is only showing a bandwidth of 3.9 Gbit/s. Do you have by any chance an explanaition for that?
Regards,
Joerg
Hi Joerg
Thanks for sharing your feedback.
Regarding your question, here are a few thoughts:
* First, you may want to verify the traffic stats in UCSM or via CLI.
* Since the two VMs/service profiles are in the same chassis, you may want to look for the utilization of the vNIC. Do you have multiple vNIC? If yes, you need to add the utilization of the both. The Server Traffic dashboard gets the stats from vNICs and it should match the values displayed by UCSM/FI.
Please keep me posted on your findings. I will probably have to look into your environment to see the exact issue.
Thanks
Paresh
Hi Paresh,
Thanks for your quick answer.
I’ve checked and the values in UTM match the values from UCSM. So there seems to be everythin fine with the UTM. I’ll investigate the envirionment to find a clue why UCSM is seeing less bandwith than vSphere-Client.
Thanks
Joerg
Thanks for the update Joerg. Please keep me posted on your findings. BTW, do you have a Cisco case open for this? If yes, I can follow it internally.
Thanks a lot a great job, installed and tested for two UCS Domain and results are awesome.
I must say, useful and super-cool utility. We have been using Grafana with openshift on UCS earlier but this use case is wonderful. Now i can map physical layer cleanly with an overlay to have a clear picture!
What an awesome tool you’ve created. Thank you! I was wondering if there is a limit to how many UCS domains this will handle?
Hi Scott,
The largest production deployment I am aware of, is monitoring 27+ domains with 1640+ servers. This is from October 2020. They were adding more so, I believe, the exact count is higher now (Dec 2020). Feel confident if you are under this limit or even go higher. Watch out for disk space utilization and add more when required or setup an automatic retention policy
I have put around 40 domains in the file
This is what is see in the telegraf.log at location /var/log
I ran a test below to check if I can connect the ucs domain from the UTM server :
Consider adding one domain per group file and modify telegraf.conf accordingly.
Hello,
Thanks a lot for what you did, an excellent job.
Can you please give us more details about configuring alerts, i see just 3 alerts (CPU, RAM and disk)
Thanks in advance
Thanks.
Please consider using UCSM for alerting. I have not enabled alerts on UTM to avoid conflicts with existing alerting infra. If you wish to do so, few options:
1. Make static dashboards for the metrics that you wish to receive alerts on. Then, graph panel to create alerts.
2. Use Kapacitor.
3. Move to InfluxDB 2.0 to use native alerting.
Hello Paresh,
Thanks a lot for your response.
I’ll test.
Best Regards
Anyone looking the possibility of adding CPU temperature statistics for long term monitoring of UTM. I know it’s focus is “traffic” but I have interest in other aspects of UCS as well.
Hi Ralph
I have received the request to monitor environment metrics like temperature and power consumption earlier also. Please help in tracking your request by raising a new issue on https://github.com/paregupt/ucs_traffic_monitor. You mentioned only CPU temperature but there are many other sensors monitoring the temperature. Please share your thoughts about your preferred sensors, like, inlet, output, power supplies, and so on. I can’t promise when I can work on it but maybe someone else can pick it up.
Cheers
Paresh
Hi, first of all, congratulations by this awesome initiative. I’m facing the following output from telegraf.log:
2021-03-23T17:53:50Z E! [inputs.exec] Error in plugin: exec: Command timed out. for command ‘python3 /usr/local/telegraf/ucs_traffic_monitor.py /usr/local/telegraf/ucs_domains_group_1.txt influxdb-lp -vv’:
i have just one domain and i’m using one file
When accessing Grafana, i’m not able to select an UCSM Domain from drop-down list, but i’m able to create a dashbord and the query is providing metrics.
Sorry for the delay. Did it work? You may open an issue on the GitHub repo: https://github.com/paregupt/ucs_traffic_monitor
Hi, first of all, thanks for this job!
I have opload and install the OVA then I upgraded using the shell script.
I’m facing the following output from telegraf.log:
No error in
Any idea ?
Hi Vincent, Glad you like it.
Regarding the output, it’s not complete. What’s the issue you are facing?
Check the existing (open and closed) issues on https://github.com/paregupt/ucs_traffic_monitor. You can learn from the experiences of other customers who ran into similar issues. With so many solved questions, I am confident that you will find the solution sooner than my response.
Hope this helps. If not, raise a new issue and we’ll look into it.
Cheers!
i am trying to upgrade to the latest version, when i run sudo ./upgrade_utm.sh i am getting an error, command not found. seems like a pretty easy task, what am i missing. i deployed from OVA (UTM_0.3)
Sorry for the delay. Can you share more details? Wondering if it says which command is missing?
How I found it:
[root@utm /]# sudo ./upgrade_utm.sh
sudo: ./upgrade_utm.sh: command not found
[root@utm /]# find . -name upgrade_utm.sh
./etc/ucs_traffic_monitor/upgrade_utm.sh
[root@utm /]# cd etc/ucs_traffic_monitor/
[root@utm ucs_traffic_monitor]# sudo upgrade_utm.sh
sudo: upgrade_utm.sh: command not found
[root@utm ucs_traffic_monitor]# upgrade_utm.sh
-bash: upgrade_utm.sh: command not found
[root@utm ucs_traffic_monitor]# sudo ./etc/ucs_traffic_monitor/upgrade_utm.sh
sudo: ./etc/ucs_traffic_monitor/upgrade_utm.sh: command not found
==> [root@utm ucs_traffic_monitor]# sudo /etc/ucs_traffic_monitor/upgrade_utm.sh
—————————
Hi there. I am Kiara.
I am 4 years old and I can help you in upgrading your UTM installation.
I learned it with my daddy while he was working on it.
—————————
—————————
May I continue? (y/n):
Is there a limit on the number of domains that can be monitored? I seem to have a limit of 10 domains. Any more than 10 the additional domains won’t ever show data.
UTM doesn’t have any scale limit. At least none that I am aware of. See this: https://github.com/paregupt/ucs_traffic_monitor/issues/56#issuecomment-833174439
To scale UTM, I suggest keeping one domain per ucs_domains_group_*.txt file. In other words, if you have 30 UCS domains, create 30 files with one domain each. You can name the file anything that helps you to find the domain inside it.
Then, in telegraf.conf, replicate the 7 lines of config 29 times.
I understand its more work. But it’s a one time effort and offers the best scalability in the long term. After using this approach, if one domain is unable to finish in 60 seconds, other domains will not be affected. Troubleshooting will be better as well.
Don’t forget to restart the telegraf service.
If you have a few mins, read through open and closes issues on github repo that has insights of others running into issues and their solutions.
Hope this helps.
Paresh
Is there a process to remove a location? .. including all old historical data?
Yeah, check https://github.com/paregupt/ucs_traffic_monitor/issues/63 and https://github.com/paregupt/ucs_traffic_monitor/issues/64
How can you verify you are running the latest version?
Log files should show the version. The latest version shows the version on the locations dashboard as well when you hover over the top panels ‘i’
During the upgrade process I got the following and was wondering if is normal? This is a fresh install and upgrading using the script.
Are you ready to upgrade UI dashboards: (y/n)y
—————————
I need Grafana Credentials.
Hint:admin/Utm_12345
—————————
Grafana User:admin
Password:
—————————
First, let’s backup your existing UTM dashboards
I have taken a backup of your existing UTM dashboards in /usr/local/telegraf/grafana/dashboards_3918012622
—————————
Now, I will try to upgrade UTM dashboards.
Are you sure: (y/n)y
cp: cannot stat ‘grafana/dashboards/chassis_pause.json’: No such file or directory
Upgrading chassis_pause — in Folder 1 — with ID 2 — to UTM version 5
jq: error: Could not open file /tmp/chassis_pause.json: No such file or directory
.
cp: cannot stat ‘grafana/dashboards/service_profile.json’: No such file or directory
Upgrading service_profile — in Folder 1 — with ID 9 — to UTM version 5
jq: error: Could not open file /tmp/service_profile.json: No such file or directory
.
cp: cannot stat ‘grafana/dashboards/domain_overview.json’: No such file or directory
Upgrading domain_overview — in Folder 1 — with ID 4 — to UTM version 5
jq: error: Could not open file /tmp/domain_overview.json: No such file or directory
.
cp: cannot stat ‘grafana/dashboards/domain_traffic.json’: No such file or directory
Upgrading domain_traffic — in Folder 1 — with ID 5 — to UTM version 5
jq: error: Could not open file /tmp/domain_traffic.json: No such file or directory
.
cp: cannot stat ‘grafana/dashboards/chassis_traffic.json’: No such file or directory
Upgrading chassis_traffic — in Folder 1 — with ID 3 — to UTM version 5
jq: error: Could not open file /tmp/chassis_traffic.json: No such file or directory
.
cp: cannot stat ‘grafana/dashboards/local_sys.json’: No such file or directory
Upgrading local_sys — in Folder 1 — with ID 7 — to UTM version 5
jq: error: Could not open file /tmp/local_sys.json: No such file or directory
.
cp: cannot stat ‘grafana/dashboards/locations.json’: No such file or directory
Upgrading locations — in Folder 1 — with ID 8 — to UTM version 5
jq: error: Could not open file /tmp/locations.json: No such file or directory
.
cp: cannot stat ‘grafana/dashboards/ingress_congestion.json’: No such file or directory
Upgrading ingress_congestion — in Folder 1 — with ID 6 — to UTM version 5
jq: error: Could not open file /tmp/ingress_congestion.json: No such file or directory
.
Done
this isn’t normal. I hope that you were able to find a solution for it. If not, see above these logs to find something else went wrong as well….
Paresh,
Thank you SO MUCH for putting UTM together. It’s invaluable to me as I finally have a solution for performance monitoring for UCS. My previous “solutions” were less than stellar.
I’m hoping to cherry pick some of the graphs out of the pre-existing dashboards and make a custom dashboard that shows Eth and FC capacity utilization only for all my UCS domains. I suspect this is something that’s done fairly easily, but all my attempts to do so haven’t been successful.
Do you have anything I could try to do this?
Thanks!
Tom, I am glad to know that UTM is invaluable to you.
Making those changes in UTM should be easy. No changes are needed on the back-end for your use-case. You may want to learn Grafana. You can save-as a dashboard to duplicate it and play with it. You can copy-paste panels across the dashboard to cherry pick what you want. If you need help, try reaching out to your Cisco rep who can connect us. I will try my best to get on a call but no commitments. UTM is still a weekend project.
This is amazing. It helped us pinpoint a bad SFP on one of our devices. Have you been able to track MDS traffic along with everything else already on here? That’s the only piece of equipment I can’t seem to find on here that would be great to have.
Hi Cody, sorry for the delayed response. I am glad to know that UTM is helpful.
Regarding monitoring MDS, please refer to https://github.com/paregupt/mds_traffic_monitor. Essentially, same UTM VM can monitor MDS switches. Try it out and keep me informed how it goes.