
Last Updated on May 17, 2020 by Paresh Gupta
Cisco SAN Analytics is the industry’s first and only integrated-by-design architecture to provide deep visibility into SCSI and NVMe traffic at scale. But what problem does it solve that you could not have solved before? Here are some examples from live customer environments.
Before a dive deep and if you are not already aware, here is a quick overview of the nomenclature. Cisco SAN Analytics is the name of the overall solution. But, the term is overloaded. It is also the name of the feature on Cisco MDS switches to collect IO flow metrics. After the collection, the metrics are exported by the switches to DCNM via streaming telemetry AKA SAN Telemetry Streaming (STS). Finally, an analytics engine in DCNM, called SAN Insights, runs advanced analytics, end-to-end correlation, and long term trending. In other words, SAN Insights is a feature of DCNM and a subset of the overall Cisco SAN Analytics solution. For more details, refer to the official Cisco SAN Analytics Solution overview or my Cisco Live session on SAN Insights.
I am going to use the terms SAN analytics and SAN Insights based on the context. But don’t let the nomenclature slow you down. The real value is in the use-cases and the problems this technology is solving for the customers.
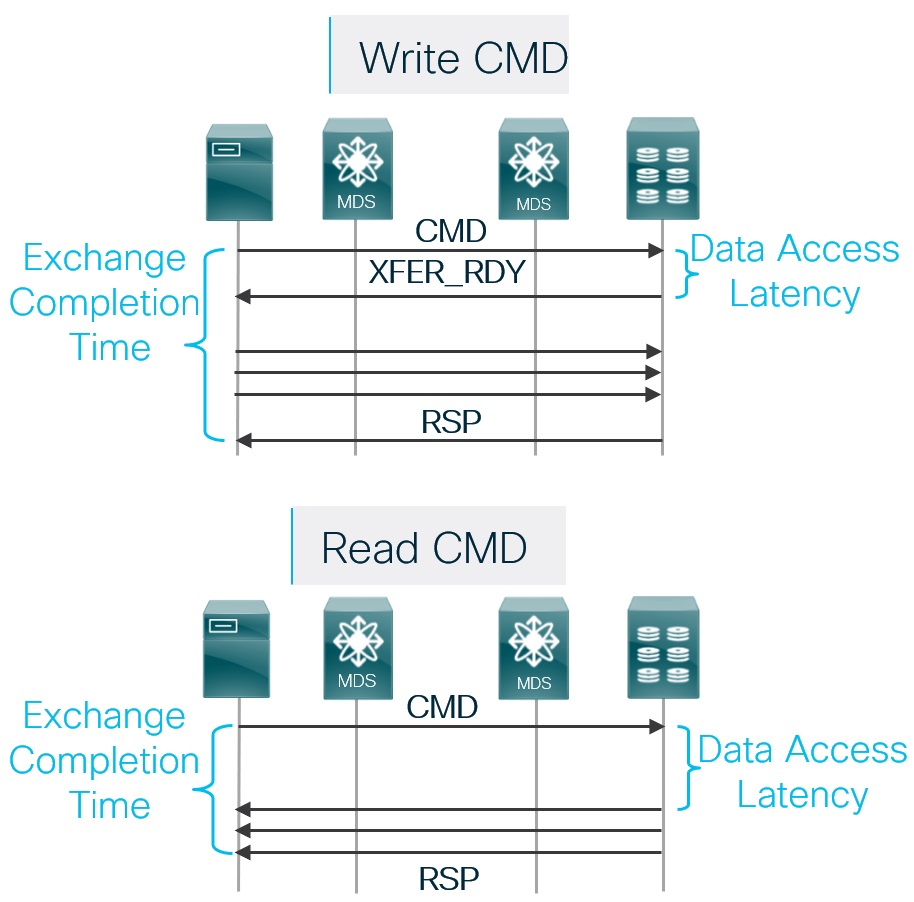
Storage access is a major component of the overall response time of an application. If the time taken to complete read and write IO transactions increases, it may increase the overall application response time. The MDS 9000 switches measure the IO completion time AKA Exchange Completion Time (ECT) at a granularity of Initiator-Target-LUN (ITL) or Initiator-Target-Namespace (ITN). Later, in DCNM SAN Insights, the ITL/ITN flows are mapped to host enclosures. This step takes into account all the paths available on a host. Overall, you get access to the average ECT of the application server which you are trying to troubleshoot for performance degradation.
If the ECT increases, storage access can very well be the reason for application performance degradation. However, if the ECT does not change, you can safely rule out storage access issues and focus your troubleshooting on the other components.
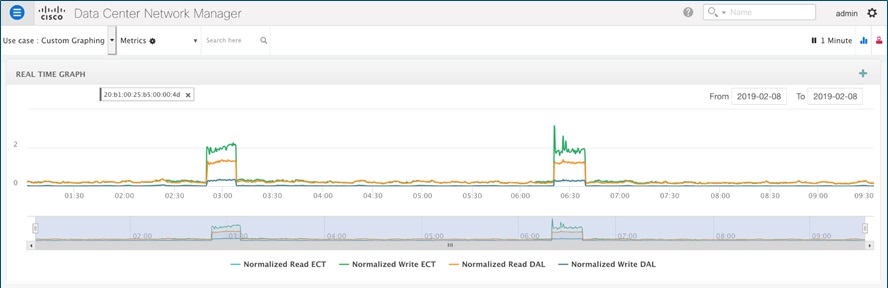
You can see the storage response times on Dashboard > SAN Insights > View SAN Insights Metrics. From the use-case drop-down, select custom graphing. Then, search the WWPN of the application server as a search key to visualize the Exchange completion time (ECT) of read and write transactions. For best results, enable SAN Analytics for 100% of the coverage and leave it always-on. Only then SAN Insights will be able to maintain a trend, baseline, and deviations (more on this later).
Measuring the response of read and write transaction is a complex process. It requires maintaining the states of the control frames like CMD, XFER_RDY, RSP, etc. in the MDS hardware. Hence, ECT information is not possible to obtain without Cisco SAN analytics.
In continuation of the use-case #3, if the application performance degrades due to storage access, you may want to know the exact location of the issue. Is it within the storage array or the host or can it be due to congestion within the SAN (potential slow drain)?
As explained in use-case #3, use Exchange Completion Time (ECT) to measure the overall storage performance. To narrow down further, ECT needs to be correlated with another important metric, called Data Access Latency (DAL).
Cisco MDS already has very powerful feature-sets to detect SAN congestion (TxWait, slowport-monitor, etc.). If there are no symptoms of SAN congestion, this can very well be an issue within the host.
The correlation between ECT, DAL, and SAN congestion may not be straight forward and requires a detailed understanding. When you understand it well, use SAN Insights to correlate ECT and DAL to find if the issue is within storage array or not.
Just like ECT, the calculation of DAL is also a complex process. It requires maintaining the states of the CMD and XFER_RDY frames and a time difference between them. It is not possible to obtain DAL without SAN analytics.
The most common issues with multi-path can be divided into two categories. First, not all the paths are active. Second, all the paths are active but the utilization is non-uniform. In both cases, the application may not report an issue because it is still able to access the storage. However, such conditions often result in major issues when you need multi-path the most.
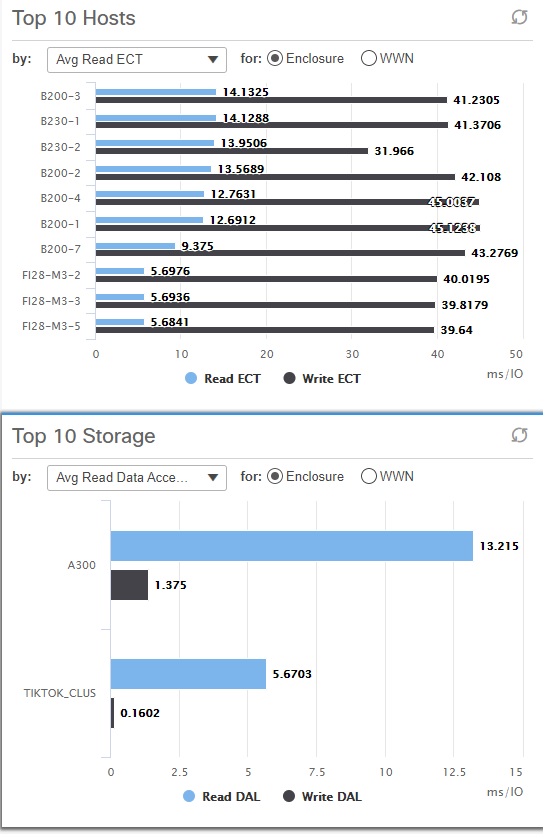
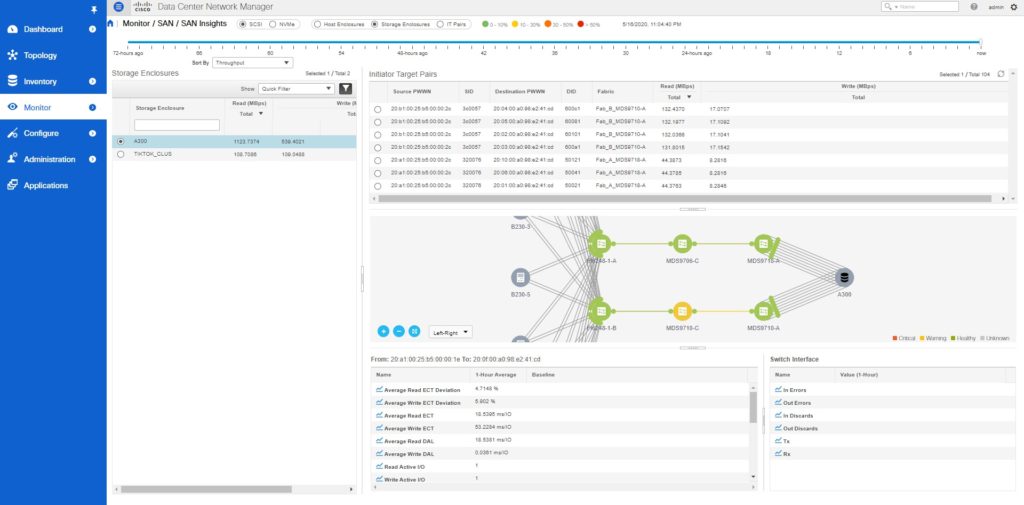
To verify multi-path in DCNM, go to monitor > SAN Insights. From the ‘Sort By’ drop-down menu, select Throughput. You will be presented with a list of all the monitored hosts or storage arrays in the decreasing order of their throughput. Then, verify the per-path throughput breakdown in the Initiator-Target Pairs panel on the right.
Refer to the below output showing non-uniform utilization of the available paths between hosts and storage.
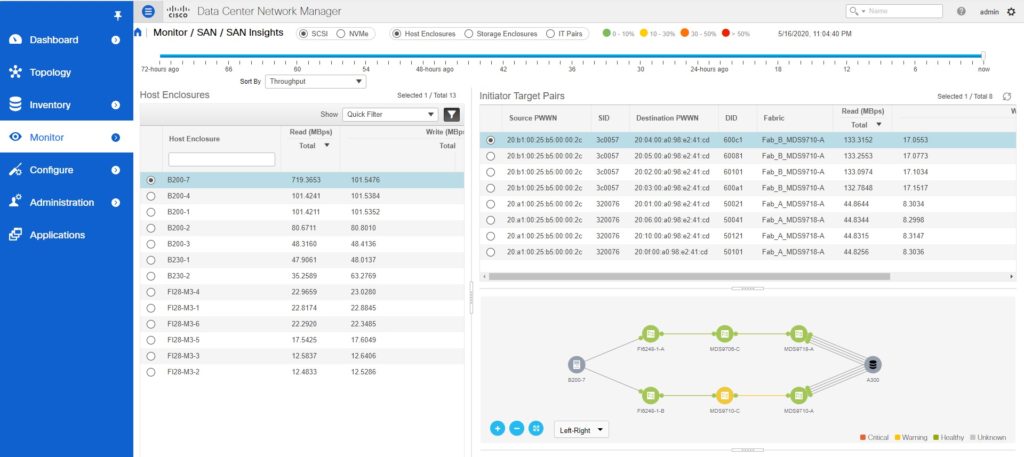
In the above figure, the overall read throughput of host B200-7 is 719 MBps. There are 8 paths between the host and the storage. The 4 paths over Fabric A are delivering ~133 MBps each. However, the 4 paths over Fabric B are only delivering ~44 MBps. This is an example where all the multi-paths are active but the utilization is non-uniform.
Refer to the following figure for an example of missing paths between hosts and storage.
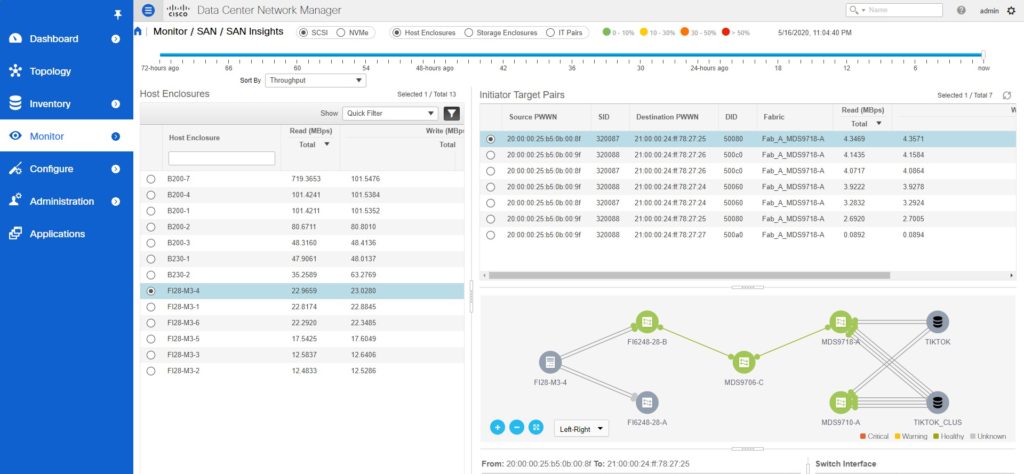
The overall read throughput of the FI28-M3-4 is ~22 MBps. Notice that Fabric B paths are completely missing. Also, the utilization over Fabric A paths is non-uniform.
Cisco UCS has a unique architecture. The Fabric Interconnects often operate in NPV mode and all the blade servers FLOGI using the uplink ports. You can monitor the traffic of the Fabric interconnect uplink port or the connected port on the NPIV SAN switch. However, getting a traffic breakdown per service profile (server) or vHBA is challenging.
Cisco SAN Analytics solves this problem by inspecting the frame headers, that carry FCID of the blade server vHBA. Then, DCNM SAN Insights correlates the initiator FCID to the WWPN of the server vHBA and the host enclosure. Finally, you get all the metrics at a granularity of a server vHBA.
Refer to the below output from Monitor > SAN Insights.
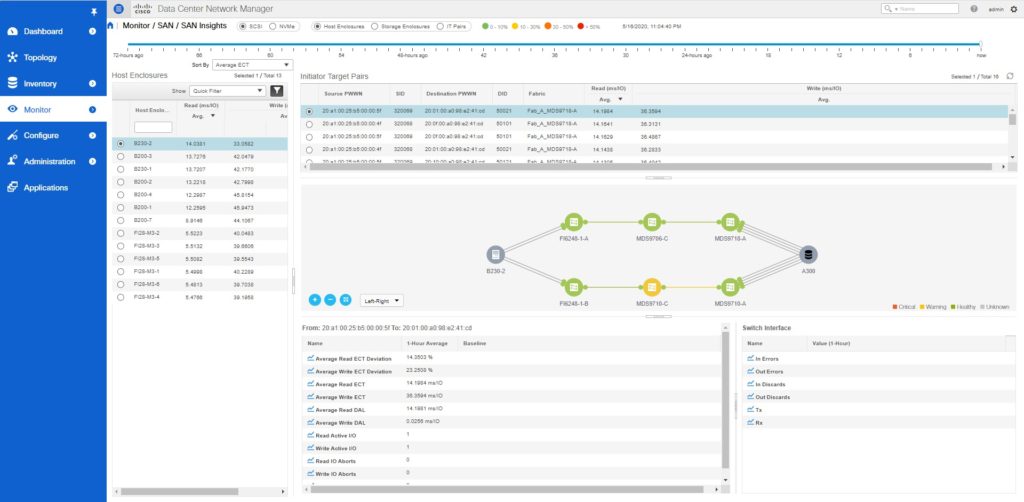
In this view, the host enclosures are the Cisco UCS blade servers. As a result, all the metrics, like Average ECT, ECT deviation, throughput, IOPS, DAL, etc. are available at a blade server granularity. Additionally, the topology shows the end-to-end path between the server HBA and storage. You can interact with the topology by taking the mouse over the network links or clicking the green dots.
As explained in the use-case #6, SAN Analytics can give you throughout and IOPS data at a blade server granularity. Using this information, you can now take an informed action of moving a storage hungry VM to a less utilized physical host or less utilized path. Without this insight, customers often make a guess or use a brute-force approach. Sometimes, customers also add unnecessary additional capacity to the links while some other links may be underutilized.
Cisco SAN analytics can provide you visibility into VM storage traffic when the VMs directly login (FLOGI) into the SAN. However, this is not a common deployment approach. Mostly, the hypervisor (ESXi) does FLOGI and acts like an IO blender for all the VMs. In this case, you can map the ESXi datastores to LUNs (using SAN Analytics) and check the mapping of the vDisk to a datastore (using vSphere). This approach adds an additional step but still, it is very powerful to help you in making a data-driven decision.
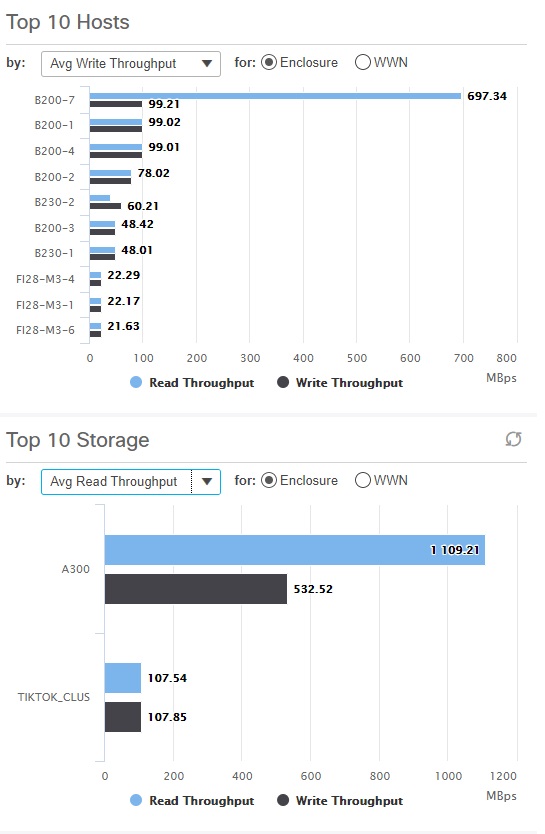
Cisco SAN Analytics can help you to verify the uniform utilization of ports of a storage array. Not just that, it also provides you detailed information to take corrective action. For example, one port of a storage array maybe 70% utilized while another port maybe just 30% utilized. SAN Insights can provide you detailed metrics at a LUN level. If one LUN is traffic-heavy, you can move the LUN association from one storage port to another.
To find this information in DCNM, go to Monitor > SAN Insights. For example, in the below figure, the combined read traffic from the A300 storage array is 1123 MBps. The Initiator-Target pair panel on the right provides a detailed breakdown.
You can see metrics at the LUN level granularity by going to Dashboard > SAN Insights > View SAN Insights Metrics > Use-case > Custom graphing.
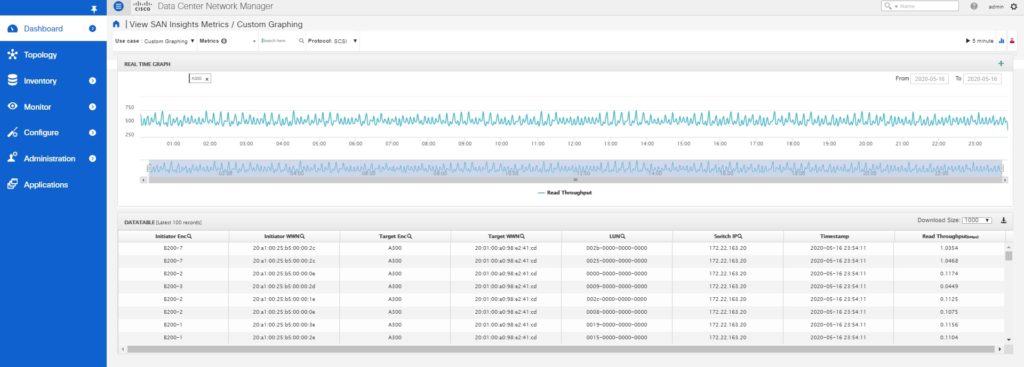
In the above figure, the read traffic from LUN ID 002b-0000-0000-0000 and 0025-0000-0000-0000 is much higher than the other LUNs.
Hardware and software change is an ongoing process in the data centers. For example, replacing faulty SFPs and cables, upgrade of HBAs, software upgrade, patching, etc. Proper verification is often challenging after the change. Today, the verification is limited due to the lack of end-to-end visibility. Due to this gap, the changes are not always successful resulting in longer downtimes or customer satisfaction issues.
Cisco SAN Analytics provides end-to-end application performance metrics natively within SAN. You can measure the metrics like ECT, IOPS, Throughput, etc. before and after making the change. For example, replacing a faculty SFP by a new SFP is often verified by a link-up event today. The limitation of this approach is that it is not an application-level verification. The link may come up but there may still be other issues that a layer-1 event may not detect. Common examples are CRC or discards. To make the change management more effective, compare the ECT, IOPS, and throughput values with the historic values. This is an end-to-end verification resulting in an improved success rate.
One of the biggest challenges for storage admins is to know the difference between good and good enough. Exchange completion time (ECT) is the most powerful storage performance metrics. But just knowing its absolute value is of little help. For example, knowing that the ECT of a host is 500 microseconds is a good data point but does not provide enough information to solve a real problem.
DCNM SAN Insights learns the ECT of an IO flow, make baselines, and also calculates deviations from the baseline. All these calculations are performed automatically. The final result for you, as an end-user, is simple to understand color codes.
Refer to the below figure from Dashboard > SAN Insights to get the overall health of all the monitored flows.
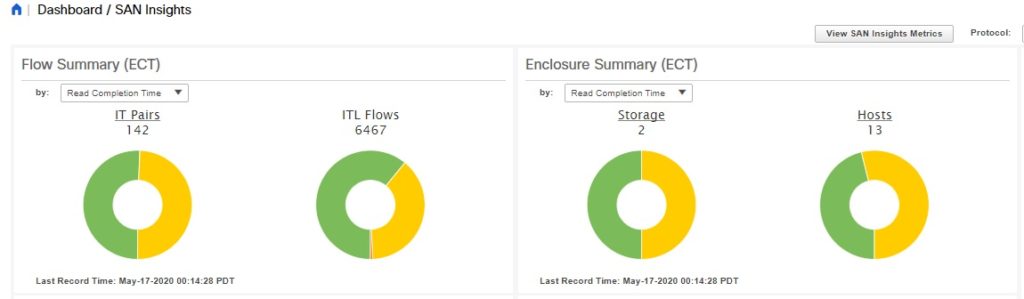
In the above figure, orange flows are deviating from their baseline ECT values more than the yellow flows. The flows in the green are showing little or no deviations from the baseline.
The following figure from Monitor > SAN Insights shows details at host or storage enclosure granularity.
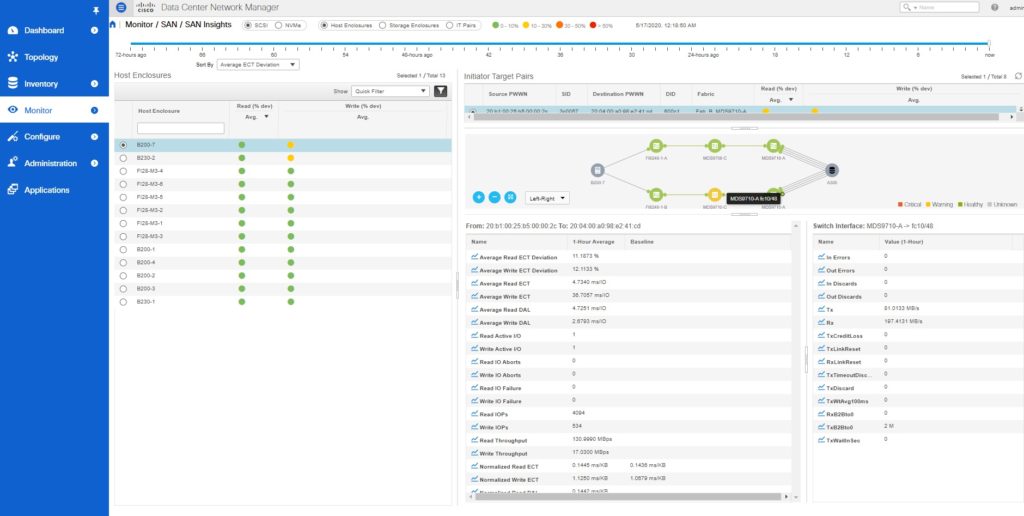
The enclosures (host or storage) are auto-sorted with the worst-performing device at the top. Notice the baseline value of normalized read and write ECT and also the average values over the last one hour. If the values in the last hour deviate from the baseline beyond a threshold, the end-device is auto-categorized into the red, orange, yellow, or green.
Without this kind of auto-learning, baseline and deviations, you will have a lot of data with little value. The learning feature of SAN Insights helps you to understand your environment better. As a result, you can detect and resolve issues proactively.
++++
SAN Analytics and SAN Insights has many more use-cases. However, my focus today is only on the most common use-cases that I have seen customers using and finding valuable.
Finally, you are always welcome to share your questions, comments, and feedback. If you made this far, congratulations, and thanks for reading.